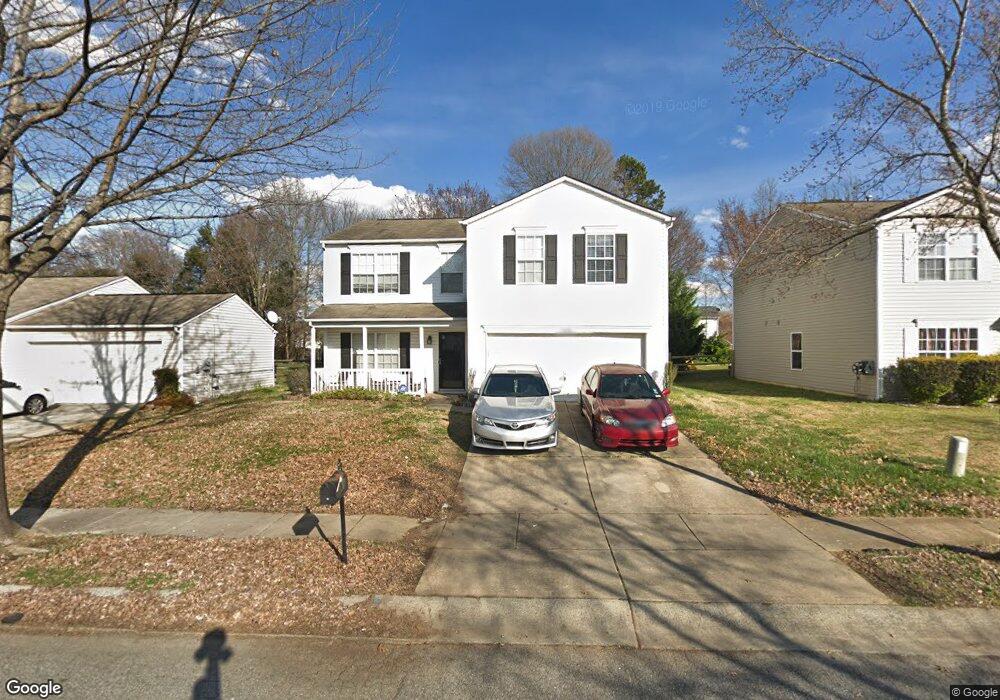
12608 Dervish Ln Unit 21 Charlotte, NC 28269
Davis Lake-Eastfield NeighborhoodEstimated Value: $365,000 - $374,000
3
Beds
3
Baths
2,128
Sq Ft
$173/Sq Ft
Est. Value
About This Home
This home is located at 12608 Dervish Ln Unit 21, Charlotte, NC 28269 and is currently estimated at $368,241, approximately $173 per square foot. 12608 Dervish Ln Unit 21 is a home located in Mecklenburg County with nearby schools including Blythe Elementary School, John M. Alexander Middle School, and North Mecklenburg High.
Ownership History
Date
Name
Owned For
Owner Type
Purchase Details
Closed on
Sep 16, 2015
Sold by
Behling Duy Kristin M and Duy Elliott M
Bought by
Cox Lisa M
Current Estimated Value
Home Financials for this Owner
Home Financials are based on the most recent Mortgage that was taken out on this home.
Original Mortgage
$162,011
Interest Rate
3.62%
Mortgage Type
FHA
Purchase Details
Closed on
Jun 10, 2013
Sold by
Wittenberg Richard P and Wittenberg Virginia G
Bought by
Behling Kristin M
Home Financials for this Owner
Home Financials are based on the most recent Mortgage that was taken out on this home.
Original Mortgage
$151,210
Interest Rate
4.4%
Mortgage Type
FHA
Purchase Details
Closed on
Jan 15, 2003
Sold by
Centex Homes
Bought by
Wittenberg Richard P and Wittenberg Virginia G
Home Financials for this Owner
Home Financials are based on the most recent Mortgage that was taken out on this home.
Original Mortgage
$144,831
Interest Rate
6.16%
Mortgage Type
FHA
Create a Home Valuation Report for This Property
The Home Valuation Report is an in-depth analysis detailing your home's value as well as a comparison with similar homes in the area
Home Values in the Area
Average Home Value in this Area
Purchase History
| Date | Buyer | Sale Price | Title Company |
|---|---|---|---|
| Cox Lisa M | $165,000 | None Available | |
| Behling Kristin M | $154,000 | None Available | |
| Wittenberg Richard P | $147,500 | -- |
Source: Public Records
Mortgage History
| Date | Status | Borrower | Loan Amount |
|---|---|---|---|
| Previous Owner | Cox Lisa M | $162,011 | |
| Previous Owner | Behling Kristin M | $151,210 | |
| Previous Owner | Wittenberg Richard P | $144,831 |
Source: Public Records
Tax History Compared to Growth
Tax History
| Year | Tax Paid | Tax Assessment Tax Assessment Total Assessment is a certain percentage of the fair market value that is determined by local assessors to be the total taxable value of land and additions on the property. | Land | Improvement |
|---|---|---|---|---|
| 2025 | $2,629 | $326,900 | $65,000 | $261,900 |
| 2024 | $2,629 | $326,900 | $65,000 | $261,900 |
| 2023 | $2,537 | $326,900 | $65,000 | $261,900 |
| 2022 | $2,104 | $205,000 | $42,000 | $163,000 |
| 2021 | $2,093 | $205,000 | $42,000 | $163,000 |
| 2020 | $2,085 | $205,000 | $42,000 | $163,000 |
| 2019 | $2,070 | $205,000 | $42,000 | $163,000 |
| 2018 | $1,568 | $113,900 | $21,000 | $92,900 |
| 2017 | $1,537 | $113,900 | $21,000 | $92,900 |
| 2016 | $1,521 | $113,400 | $21,000 | $92,400 |
| 2015 | $1,510 | $113,400 | $21,000 | $92,400 |
| 2014 | $1,519 | $113,400 | $21,000 | $92,400 |
Source: Public Records
Map
Nearby Homes
- 12624 Dervish Ln
- 12422 Cardinal Point Rd
- 10420 Benfield Rd
- 12918 Eastfield Rd
- 13044 Fen Ct
- 6511 Eastfield Park Dr
- 13030 Fen Ct
- 12130 Wild Garden Ct
- 13056 Long Common Pkwy
- 9011 Foggy Meadow Rd
- 9901 Benfield Rd Unit 302
- 9901 Benfield Rd Unit 111
- 9901 Benfield Rd Unit 301
- 9901 Benfield Rd Unit 219
- 9901 Benfield Rd Unit 506
- 9901 Benfield Rd Unit 309
- 9901 Benfield Rd Unit 316
- 9901 Benfield Rd Unit 515
- 9901 Benfield Rd Unit 508
- 9901 Benfield Rd Unit 514
- 12608 Dervish Ln
- 12612 Dervish Ln
- 12604 Dervish Ln
- 12616 Dervish Ln
- 12600 Dervish Ln
- 12509 Cardinal Point Rd
- 12501 Cardinal Point Rd
- 12517 Cardinal Point Rd
- 12611 Dervish Ln
- 12603 Dervish Ln
- 12620 Dervish Ln
- 12532 Dervish Ln
- 12443 Cardinal Point Rd
- 12615 Dervish Ln
- 6603 Sweetfield Dr
- 12533 Dervish Ln
- 12528 Dervish Ln
- 6609 Sweetfield Dr
- 12437 Cardinal Point Rd
- 12621 Dervish Ln