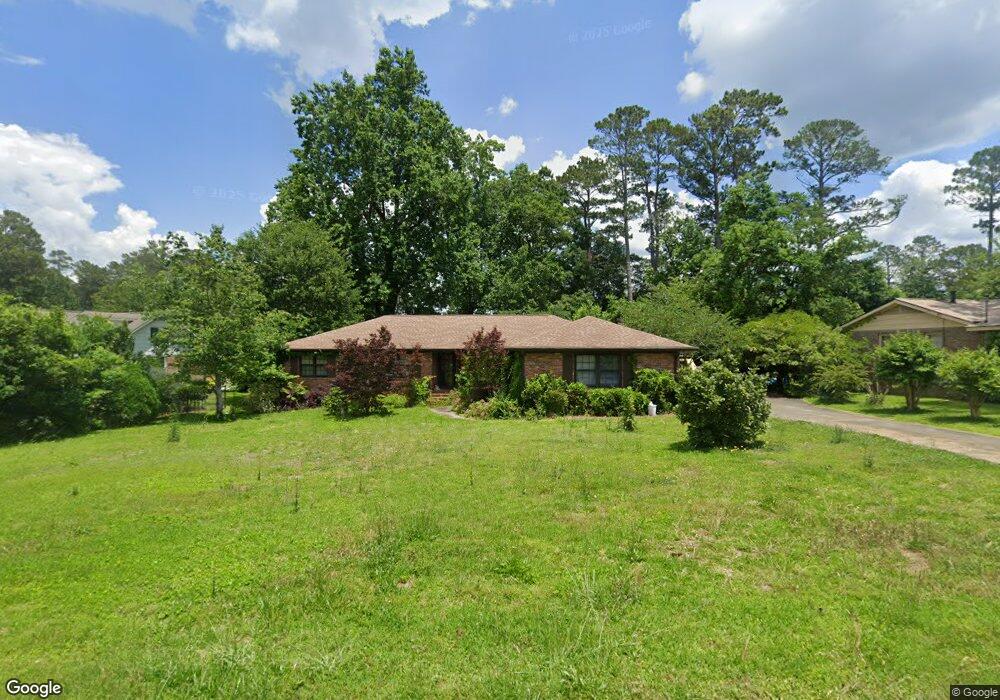
1261 Darlington Dr Macon, GA 31210
Estimated Value: $227,000 - $264,000
3
Beds
2
Baths
2,054
Sq Ft
$119/Sq Ft
Est. Value
About This Home
This home is located at 1261 Darlington Dr, Macon, GA 31210 and is currently estimated at $244,555, approximately $119 per square foot. 1261 Darlington Dr is a home located in Bibb County with nearby schools including Lane Elementary School, Howard Middle School, and Howard High School.
Ownership History
Date
Name
Owned For
Owner Type
Purchase Details
Closed on
Mar 11, 2011
Sold by
Fannie Mae
Bought by
Cannon Betty H
Current Estimated Value
Purchase Details
Closed on
Jan 4, 2011
Sold by
Houser Nathaniel
Bought by
Everbank
Purchase Details
Closed on
Jul 25, 2007
Sold by
Hamlin Joseph W
Bought by
Houser Nathaniel
Home Financials for this Owner
Home Financials are based on the most recent Mortgage that was taken out on this home.
Original Mortgage
$132,000
Interest Rate
6.65%
Mortgage Type
Unknown
Purchase Details
Closed on
Jul 20, 2007
Sold by
Swafford Kelly Hamlin Pittman
Bought by
Hamlin Joseph W
Home Financials for this Owner
Home Financials are based on the most recent Mortgage that was taken out on this home.
Original Mortgage
$132,000
Interest Rate
6.65%
Mortgage Type
Unknown
Create a Home Valuation Report for This Property
The Home Valuation Report is an in-depth analysis detailing your home's value as well as a comparison with similar homes in the area
Home Values in the Area
Average Home Value in this Area
Purchase History
| Date | Buyer | Sale Price | Title Company |
|---|---|---|---|
| Cannon Betty H | $97,000 | None Available | |
| Everbank | $126,400 | -- | |
| Federal National Mortgage Association | $126,392 | None Available | |
| Everbank | $126,391 | None Available | |
| Houser Nathaniel | $132,000 | None Available | |
| Hamlin Joseph W | -- | None Available | |
| Hamlin Joseph W | -- | None Available |
Source: Public Records
Mortgage History
| Date | Status | Borrower | Loan Amount |
|---|---|---|---|
| Previous Owner | Houser Nathaniel | $132,000 |
Source: Public Records
Tax History Compared to Growth
Tax History
| Year | Tax Paid | Tax Assessment Tax Assessment Total Assessment is a certain percentage of the fair market value that is determined by local assessors to be the total taxable value of land and additions on the property. | Land | Improvement |
|---|---|---|---|---|
| 2025 | $2,015 | $82,014 | $11,750 | $70,264 |
| 2024 | $2,083 | $82,014 | $11,750 | $70,264 |
| 2023 | $1,573 | $61,935 | $9,400 | $52,535 |
| 2022 | $2,443 | $70,561 | $9,610 | $60,951 |
| 2021 | $1,808 | $61,439 | $8,072 | $53,367 |
| 2020 | $1,785 | $59,843 | $8,072 | $51,771 |
| 2019 | $1,549 | $53,456 | $8,072 | $45,384 |
| 2018 | $2,266 | $48,696 | $7,303 | $41,393 |
| 2017 | $1,188 | $45,894 | $7,694 | $38,200 |
| 2016 | $1,019 | $43,898 | $7,694 | $36,204 |
| 2015 | $1,447 | $43,898 | $7,694 | $36,204 |
| 2014 | $637 | $46,749 | $8,549 | $38,200 |
Source: Public Records
Map
Nearby Homes
- 870 Glen Hill Ct
- 859 Forest Lake Dr S
- 825 Forest Lake Dr S
- 1270 Lake Valley Rd
- 1344 Lake Valley Rd
- 1224 Timberlane Dr
- 1161 Ousley Place
- 731 Lokchapee Dr
- 753 Lokchapee Dr
- 938 Lundy Terrace
- 121 Brookstone Way
- 3678 Northside Dr
- 673 Commanche Dr
- 636 Lokchapee Ridge
- 3640 Northside Dr
- 1197 Matthews Place
- 3622 Northside Dr
- 627 Lokchapee Ridge
- 3602 Northside Dr
- 750 Stonington Place
- 1251 Darlington Dr
- 1324 Normandy Rd
- 1314 Normandy Rd
- 1243 Darlington Dr
- 1248 Camden Rd
- 1264 Darlington Dr
- 1338 Normandy Rd
- 1302 Normandy Rd
- 1238 Camden Rd
- 1233 Darlington Dr
- 1348 Normandy Rd
- 1317 Normandy Rd
- 1325 Normandy Rd
- 1230 Camden Rd
- 1333 Normandy Rd
- 1360 Normandy Rd
- 1271 Forest Hill Rd
- 1225 Darlington Dr
- 1225 Darlington Dr Unit G15
- 1301 Normandy Rd