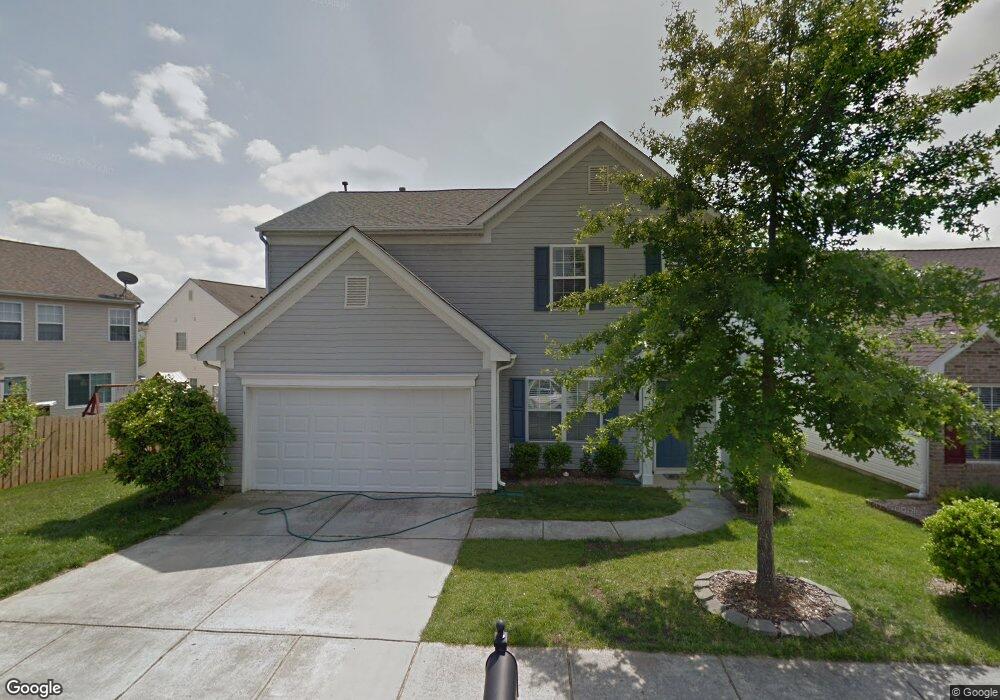
1261 Turning Leaf St NW Unit 53 Concord, NC 28027
Estimated Value: $389,000 - $403,000
4
Beds
3
Baths
1,823
Sq Ft
$216/Sq Ft
Est. Value
About This Home
This home is located at 1261 Turning Leaf St NW Unit 53, Concord, NC 28027 and is currently estimated at $394,597, approximately $216 per square foot. 1261 Turning Leaf St NW Unit 53 is a home located in Cabarrus County with nearby schools including W.R. Odell Elementary School, Harris Road Middle, and Cox Mill High School.
Ownership History
Date
Name
Owned For
Owner Type
Purchase Details
Closed on
May 26, 2011
Sold by
Hagans Kerry Jo
Bought by
Mullet Lonnie C and Mullet Deborah
Current Estimated Value
Purchase Details
Closed on
Feb 2, 2010
Sold by
Mullet Lonnie C and Mullet Deborah
Bought by
Renukuntla Vinay Kumar and Renukuntla Ramya
Home Financials for this Owner
Home Financials are based on the most recent Mortgage that was taken out on this home.
Original Mortgage
$160,000
Interest Rate
4.3%
Mortgage Type
New Conventional
Purchase Details
Closed on
Apr 23, 2007
Sold by
Kellswater Bridge Development Llc
Bought by
Finney Builders Inc
Purchase Details
Closed on
Apr 21, 2004
Sold by
Mdc Homes Charlotte Llc
Bought by
Hagans Kerry Jo
Home Financials for this Owner
Home Financials are based on the most recent Mortgage that was taken out on this home.
Original Mortgage
$145,500
Interest Rate
5.38%
Mortgage Type
FHA
Create a Home Valuation Report for This Property
The Home Valuation Report is an in-depth analysis detailing your home's value as well as a comparison with similar homes in the area
Home Values in the Area
Average Home Value in this Area
Purchase History
| Date | Buyer | Sale Price | Title Company |
|---|---|---|---|
| Mullet Lonnie C | $147,500 | None Available | |
| Renukuntla Vinay Kumar | $200,000 | None Available | |
| Finney Builders Inc | $224,000 | None Available | |
| Hagans Kerry Jo | $148,000 | -- |
Source: Public Records
Mortgage History
| Date | Status | Borrower | Loan Amount |
|---|---|---|---|
| Previous Owner | Renukuntla Vinay Kumar | $160,000 | |
| Previous Owner | Hagans Kerry Jo | $145,500 |
Source: Public Records
Tax History Compared to Growth
Tax History
| Year | Tax Paid | Tax Assessment Tax Assessment Total Assessment is a certain percentage of the fair market value that is determined by local assessors to be the total taxable value of land and additions on the property. | Land | Improvement |
|---|---|---|---|---|
| 2025 | $3,551 | $356,550 | $84,000 | $272,550 |
| 2024 | $3,551 | $356,550 | $84,000 | $272,550 |
| 2023 | $2,630 | $215,580 | $52,000 | $163,580 |
| 2022 | $2,630 | $215,580 | $52,000 | $163,580 |
| 2021 | $2,630 | $215,580 | $52,000 | $163,580 |
| 2020 | $2,630 | $215,580 | $52,000 | $163,580 |
| 2019 | $1,974 | $161,810 | $38,000 | $123,810 |
| 2018 | $1,942 | $161,810 | $38,000 | $123,810 |
| 2017 | $1,909 | $161,810 | $38,000 | $123,810 |
| 2016 | $1,133 | $143,240 | $33,000 | $110,240 |
| 2015 | -- | $143,240 | $33,000 | $110,240 |
| 2014 | -- | $143,240 | $33,000 | $110,240 |
Source: Public Records
Map
Nearby Homes
- 9720 Walkers Glen Dr NW
- 1266 Amber Ridge Rd NW
- 9768 Walkers Glen Dr NW
- 9803 Walkers Glen Dr NW
- 9610 Walkers Glen Dr NW
- 9430 Pepperidge Ave NW
- 1498 Burrell Ave NW
- 1418 Skidaway St NW Unit 427
- 9611 Marquette St NW
- 1423 Napa St NW
- 9515 Coast Laurel Ave NW
- 1656 Respect St NW
- 9532 Teamwork St NW
- 1648 Respect St NW
- 9528 Teamwork St NW
- 9526 Teamwork St NW
- 9524 Teamwork St NW
- 9593 Valencia Ave NW
- 1598 Respect St NW
- 1559 Broderick St NW
- 1261 Turning Leaf St NW
- 1265 Turning Leaf St NW
- 9418 Leverwood Ave NW
- 9414 Leverwood Ave NW
- 1271 Turning Leaf St NW
- 9459 Grand Oaks St NW
- 9459 Grand Oaks St NW Unit 40
- 9463 Grand Oaks St NW
- 1266 Turning Leaf St NW
- 9455 Grand Oaks St NW
- 1262 Turning Leaf St NW
- 1270 Turning Leaf St NW
- 1258 Turning Leaf St NW
- 1275 Turning Leaf St NW
- 1275 Turning Leaf St NW Unit 50
- 9451 Grand Oaks St NW
- 1254 Turning Leaf St NW
- 1274 Turning Leaf St NW
- 9415 Leverwood Ave NW
- 9415 Leverwood Ave NW Unit 27