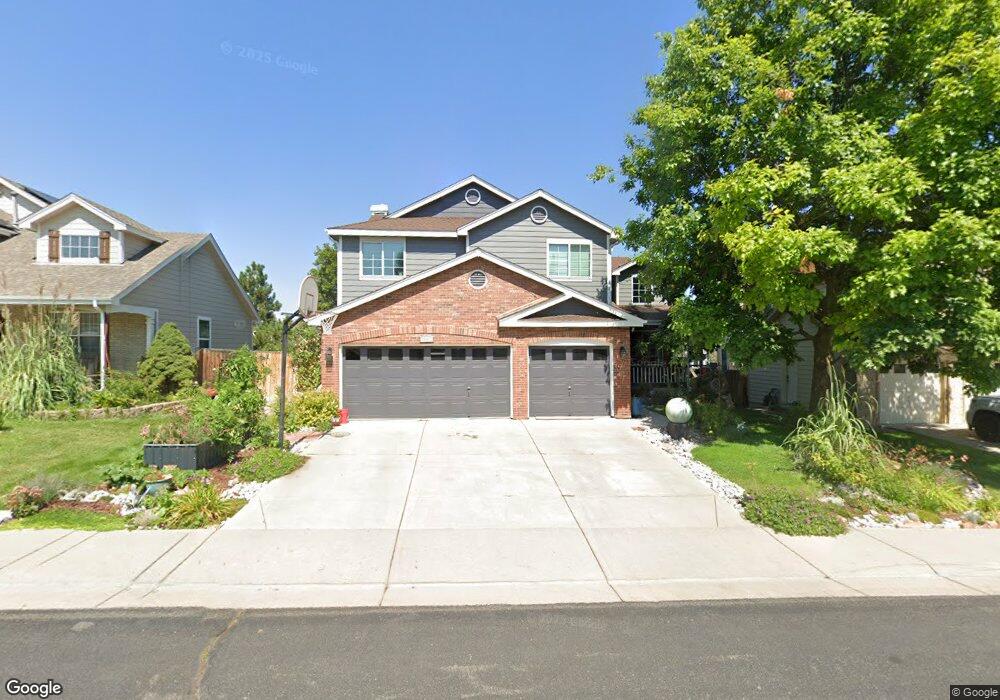
12611 W 84th Cir Arvada, CO 80005
Lakecrest NeighborhoodEstimated Value: $815,000 - $934,000
4
Beds
5
Baths
3,985
Sq Ft
$220/Sq Ft
Est. Value
About This Home
This home is located at 12611 W 84th Cir, Arvada, CO 80005 and is currently estimated at $878,213, approximately $220 per square foot. 12611 W 84th Cir is a home located in Jefferson County with nearby schools including Sierra Elementary School, Oberon Middle School, and Ralston Valley Senior High School.
Ownership History
Date
Name
Owned For
Owner Type
Purchase Details
Closed on
Jul 28, 2014
Sold by
Spellman James P and Spellman Virginia E
Bought by
Meyer Jeffrey S and Meyer Monica L
Current Estimated Value
Home Financials for this Owner
Home Financials are based on the most recent Mortgage that was taken out on this home.
Original Mortgage
$351,920
Outstanding Balance
$269,238
Interest Rate
4.2%
Mortgage Type
New Conventional
Estimated Equity
$608,975
Purchase Details
Closed on
May 31, 1994
Sold by
Meister Spencer A and Meister Ellyn G
Bought by
Spellman James P and Spellman Virginia E
Home Financials for this Owner
Home Financials are based on the most recent Mortgage that was taken out on this home.
Original Mortgage
$172,800
Interest Rate
7.31%
Create a Home Valuation Report for This Property
The Home Valuation Report is an in-depth analysis detailing your home's value as well as a comparison with similar homes in the area
Home Values in the Area
Average Home Value in this Area
Purchase History
| Date | Buyer | Sale Price | Title Company |
|---|---|---|---|
| Meyer Jeffrey S | $439,900 | First American | |
| Spellman James P | $216,000 | Land Title |
Source: Public Records
Mortgage History
| Date | Status | Borrower | Loan Amount |
|---|---|---|---|
| Open | Meyer Jeffrey S | $351,920 | |
| Previous Owner | Spellman James P | $172,800 |
Source: Public Records
Tax History Compared to Growth
Tax History
| Year | Tax Paid | Tax Assessment Tax Assessment Total Assessment is a certain percentage of the fair market value that is determined by local assessors to be the total taxable value of land and additions on the property. | Land | Improvement |
|---|---|---|---|---|
| 2024 | $4,613 | $47,562 | $11,002 | $36,560 |
| 2023 | $4,613 | $47,562 | $11,002 | $36,560 |
| 2022 | $4,025 | $41,101 | $9,988 | $31,113 |
| 2021 | $4,092 | $42,283 | $10,275 | $32,008 |
| 2020 | $3,833 | $39,724 | $9,818 | $29,906 |
| 2019 | $3,782 | $39,724 | $9,818 | $29,906 |
| 2018 | $3,441 | $35,140 | $6,653 | $28,487 |
| 2017 | $3,150 | $35,140 | $6,653 | $28,487 |
| 2016 | $3,229 | $33,936 | $7,978 | $25,958 |
| 2015 | $2,915 | $33,936 | $7,978 | $25,958 |
| 2014 | $2,915 | $28,791 | $5,572 | $23,219 |
Source: Public Records
Map
Nearby Homes
- 8364 Xenon St
- 13135 W 86th Ave
- 13314 W 86th Dr
- 12825 W 81st Ave
- 13105 W 81st Ave
- 13405 W 82nd Ave
- 8557 Coors Loop
- 11641 W 83rd Place
- 7840 W 87th Dr
- 8334 Deframe Ct
- 11409 W 85th Place
- 8895 Alkire St
- 8055 Simms St
- 8280 Queen St
- 8436 Pierson Ct
- 11854 W 76th Ln
- 11802 W 77th Dr
- 8438 Flora St
- 11495 W 77th Dr
- 8726 Gardenia Cir
- 12591 W 84th Cir
- 12631 W 84th Cir
- 8454 Wright St
- 8450 Wright St
- 12651 W 84th Cir
- 12571 W 84th Cir
- 8458 Wright St
- 8448 Wright St
- 12482 W 84th Cir
- 12610 W 84th Cir
- 12630 W 84th Cir
- 12590 W 84th Cir
- 12671 W 84th Cir
- 12551 W 84th Cir
- 12650 W 84th Cir
- 12472 W 84th Cir
- 8444 Wright St
- 12570 W 84th Cir
- 12670 W 84th Cir
- 12691 W 84th Cir