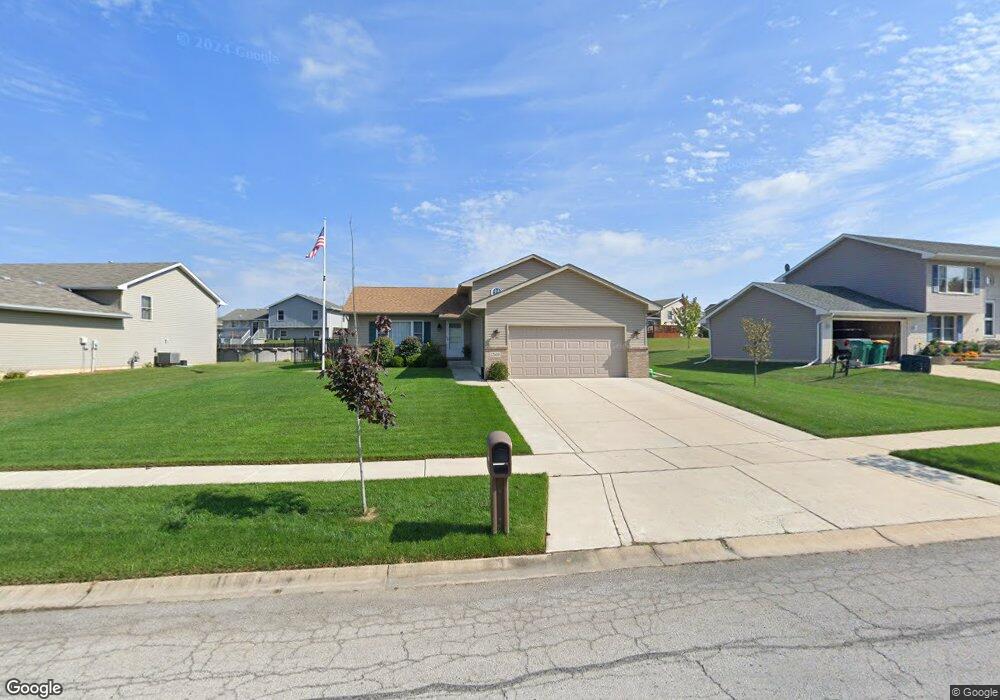
12619 Marsh Landing Pkwy Cedar Lake, IN 46303
Estimated Value: $344,000 - $432,000
4
Beds
3
Baths
1,892
Sq Ft
$202/Sq Ft
Est. Value
About This Home
This home is located at 12619 Marsh Landing Pkwy, Cedar Lake, IN 46303 and is currently estimated at $382,246, approximately $202 per square foot. 12619 Marsh Landing Pkwy is a home located in Lake County with nearby schools including Hanover Central Middle School, Lincoln Elementary School, and Hanover Central High School.
Ownership History
Date
Name
Owned For
Owner Type
Purchase Details
Closed on
Sep 9, 2016
Sold by
Maria Ann K and Lnge Ann Maria
Bought by
Anguiano Anna Maria K and Anguiano Jr Joseph K
Current Estimated Value
Home Financials for this Owner
Home Financials are based on the most recent Mortgage that was taken out on this home.
Original Mortgage
$167,500
Interest Rate
3.42%
Mortgage Type
New Conventional
Purchase Details
Closed on
Jan 7, 2011
Sold by
Accent Homes Inc
Bought by
Lange Anna Maria Kristina
Home Financials for this Owner
Home Financials are based on the most recent Mortgage that was taken out on this home.
Original Mortgage
$180,285
Interest Rate
5.5%
Mortgage Type
FHA
Purchase Details
Closed on
Nov 8, 2007
Sold by
Southshore Properties Ltd
Bought by
Accent Homes Inc
Create a Home Valuation Report for This Property
The Home Valuation Report is an in-depth analysis detailing your home's value as well as a comparison with similar homes in the area
Home Values in the Area
Average Home Value in this Area
Purchase History
| Date | Buyer | Sale Price | Title Company |
|---|---|---|---|
| Anguiano Anna Maria K | -- | Ravenswood Title Co Llc | |
| Lange Anna Maria Kristina | -- | Fidelity Mo | |
| Accent Homes Inc | -- | Ticor Mo |
Source: Public Records
Mortgage History
| Date | Status | Borrower | Loan Amount |
|---|---|---|---|
| Previous Owner | Anguiano Anna Maria K | $167,500 | |
| Previous Owner | Lange Anna Maria Kristina | $180,285 |
Source: Public Records
Tax History Compared to Growth
Tax History
| Year | Tax Paid | Tax Assessment Tax Assessment Total Assessment is a certain percentage of the fair market value that is determined by local assessors to be the total taxable value of land and additions on the property. | Land | Improvement |
|---|---|---|---|---|
| 2024 | $7,984 | $310,300 | $53,900 | $256,400 |
| 2023 | $3,426 | $300,300 | $45,800 | $254,500 |
| 2022 | $3,426 | $279,600 | $45,800 | $233,800 |
| 2021 | $2,904 | $251,400 | $45,800 | $205,600 |
| 2020 | $2,972 | $246,400 | $45,800 | $200,600 |
| 2019 | $2,716 | $237,500 | $45,800 | $191,700 |
| 2018 | $2,803 | $225,300 | $45,800 | $179,500 |
| 2017 | $2,881 | $218,700 | $45,800 | $172,900 |
| 2016 | $2,832 | $211,500 | $45,800 | $165,700 |
| 2014 | $2,538 | $217,900 | $45,800 | $172,100 |
| 2013 | $2,694 | $218,500 | $45,800 | $172,700 |
Source: Public Records
Map
Nearby Homes
- 12818 Marsh Landing Pkwy
- 9414 W 125th Ct
- 12818 Parrish Ave
- 12732 Wrightwood St
- 12548 Parrish Ave
- 8207 W 127th Ave
- 8901 W 130th Ct
- 7324 Lake Shore Dr
- 9567 Mill Creek Rd
- 13025 Tyler St
- 10002 W 128th Ave
- 8109 W 127th Ln
- 106 W 133rd Ave
- 12624 Sunnyside Place
- 13134 Parrish Ave
- 8125 Lake Shore Dr Unit 5
- 8121 Lake Shore Dr Unit 6
- 8518 W 131st Ln
- 8024 W 127th Ave
- 13125 Polk St
- 12617 Marsh Landing Pkwy
- 12701 Marsh Landing Pkwy
- 125115 Marsh Landing Pkwy
- 12700 Havenwood Pass
- 12622 Havenwood Pass
- 12705 Marsh Landing Pkwy
- 12615 Marsh Landing Pkwy
- 12702 Havenwood Pass
- 12618 Marsh Landing Pkwy
- 12620 Marsh Landing Pkwy
- 12616 Marsh Landing Pkwy
- 12707 Marsh Landing Pkwy
- 12613 Marsh Landing Pkwy
- 12704 Havenwood Pass
- 12614 Marsh Landing Pkwy
- 12704 Marsh Landing Pkwy
- 12618 Havenwood Pass
- 12709 Marsh Landing Pkwy
- 12612 Marsh Landing Pkwy
- 12701 Havenwood Pass