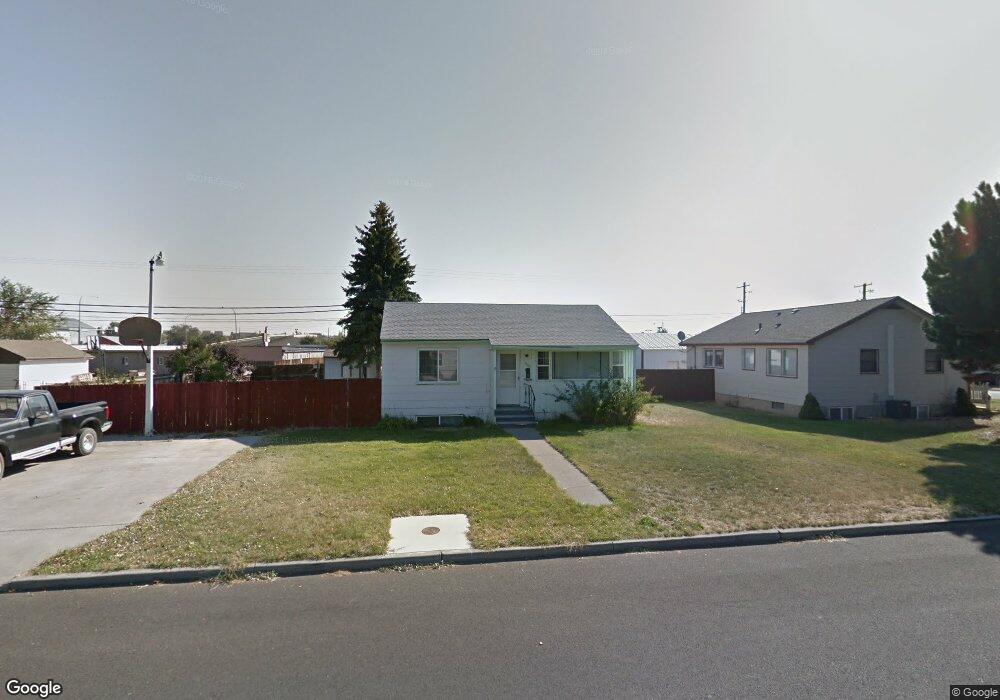
1262 C St SW Ephrata, WA 98823
Estimated Value: $236,000 - $312,000
4
Beds
2
Baths
768
Sq Ft
$342/Sq Ft
Est. Value
About This Home
This home is located at 1262 C St SW, Ephrata, WA 98823 and is currently estimated at $262,863, approximately $342 per square foot. 1262 C St SW is a home located in Grant County with nearby schools including Ephrata High School, New Life Christian School, and St. Rose of Lima Catholic School.
Ownership History
Date
Name
Owned For
Owner Type
Purchase Details
Closed on
Oct 25, 2005
Sold by
Jacobson Peggy and Jacobson Christopher
Bought by
Stevens Rose M
Current Estimated Value
Home Financials for this Owner
Home Financials are based on the most recent Mortgage that was taken out on this home.
Original Mortgage
$410,000
Interest Rate
6%
Mortgage Type
Seller Take Back
Purchase Details
Closed on
Jul 20, 2005
Sold by
Wyman Debra L
Bought by
Wyman Joy and Wyman Lewis M
Create a Home Valuation Report for This Property
The Home Valuation Report is an in-depth analysis detailing your home's value as well as a comparison with similar homes in the area
Home Values in the Area
Average Home Value in this Area
Purchase History
| Date | Buyer | Sale Price | Title Company |
|---|---|---|---|
| Stevens Rose M | -- | Security Title Guaranty | |
| Stevens Rose M | -- | Chicago Title Ins Co | |
| Stevens Rose M | $460,000 | Chicago Title Ins Co | |
| Wyman Joy | -- | Chicago Title Ins Co |
Source: Public Records
Mortgage History
| Date | Status | Borrower | Loan Amount |
|---|---|---|---|
| Previous Owner | Stevens Rose M | $410,000 |
Source: Public Records
Tax History Compared to Growth
Tax History
| Year | Tax Paid | Tax Assessment Tax Assessment Total Assessment is a certain percentage of the fair market value that is determined by local assessors to be the total taxable value of land and additions on the property. | Land | Improvement |
|---|---|---|---|---|
| 2024 | $1,942 | $171,848 | $20,000 | $151,848 |
| 2023 | $1,908 | $147,440 | $20,000 | $127,440 |
| 2022 | $1,840 | $147,440 | $20,000 | $127,440 |
| 2021 | $1,641 | $147,440 | $20,000 | $127,440 |
| 2020 | $1,535 | $125,275 | $20,000 | $105,275 |
| 2019 | $1,092 | $102,530 | $20,000 | $82,530 |
| 2018 | $1,486 | $102,410 | $16,000 | $86,410 |
| 2017 | $1,226 | $90,065 | $16,000 | $74,065 |
| 2016 | $1,333 | $90,835 | $16,000 | $74,835 |
| 2013 | -- | $81,220 | $16,000 | $65,220 |
Source: Public Records
Map
Nearby Homes