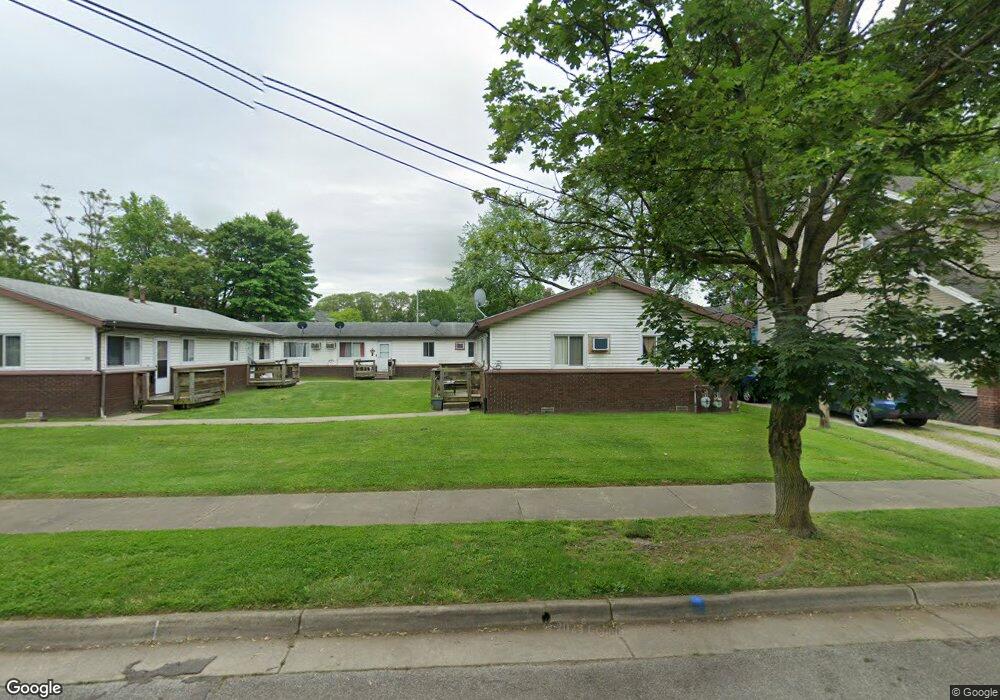
1262 California Ave Akron, OH 44314
Kenmore NeighborhoodEstimated Value: $74,000 - $126,000
4
Beds
2
Baths
1,248
Sq Ft
$77/Sq Ft
Est. Value
About This Home
This home is located at 1262 California Ave, Akron, OH 44314 and is currently estimated at $96,541, approximately $77 per square foot. 1262 California Ave is a home located in Summit County with nearby schools including Imagine Akron Academy, Emmanuel Christian Academy, and Sam Salem Community Learning Center.
Ownership History
Date
Name
Owned For
Owner Type
Purchase Details
Closed on
Mar 14, 2016
Sold by
Masters Theresa M
Bought by
Masters Michael T
Current Estimated Value
Purchase Details
Closed on
Oct 20, 2015
Sold by
Masters Michael T
Bought by
Dotson Terry and Dotson Kim
Home Financials for this Owner
Home Financials are based on the most recent Mortgage that was taken out on this home.
Original Mortgage
$180,000
Outstanding Balance
$113,764
Interest Rate
5.25%
Mortgage Type
FHA
Estimated Equity
-$17,223
Purchase Details
Closed on
Sep 13, 2011
Sold by
Masters Michael T and Parker Edward
Bought by
Masters Michael T
Home Financials for this Owner
Home Financials are based on the most recent Mortgage that was taken out on this home.
Original Mortgage
$80,000
Interest Rate
4.4%
Mortgage Type
Future Advance Clause Open End Mortgage
Create a Home Valuation Report for This Property
The Home Valuation Report is an in-depth analysis detailing your home's value as well as a comparison with similar homes in the area
Home Values in the Area
Average Home Value in this Area
Purchase History
| Date | Buyer | Sale Price | Title Company |
|---|---|---|---|
| Masters Michael T | -- | Kingdom Title | |
| Dotson Terry | $200,000 | Attorney | |
| Masters Michael T | $79,000 | Chicago Title Insurance Co |
Source: Public Records
Mortgage History
| Date | Status | Borrower | Loan Amount |
|---|---|---|---|
| Open | Dotson Terry | $180,000 | |
| Closed | Masters Michael T | $80,000 |
Source: Public Records
Tax History Compared to Growth
Tax History
| Year | Tax Paid | Tax Assessment Tax Assessment Total Assessment is a certain percentage of the fair market value that is determined by local assessors to be the total taxable value of land and additions on the property. | Land | Improvement |
|---|---|---|---|---|
| 2025 | $1,034 | $17,864 | $5,957 | $11,907 |
| 2024 | $1,034 | $17,864 | $5,957 | $11,907 |
| 2023 | $1,034 | $17,864 | $5,957 | $11,907 |
| 2022 | $797 | $10,508 | $3,504 | $7,004 |
| 2021 | $797 | $10,508 | $3,504 | $7,004 |
| 2020 | $787 | $10,500 | $3,500 | $7,000 |
| 2019 | $1,072 | $13,470 | $3,910 | $9,560 |
| 2018 | $1,158 | $13,470 | $3,910 | $9,560 |
| 2017 | $1,411 | $13,470 | $3,910 | $9,560 |
| 2016 | $1,412 | $18,100 | $5,260 | $12,840 |
| 2015 | $1,411 | $18,100 | $5,260 | $12,840 |
| 2014 | $1,400 | $18,100 | $5,260 | $12,840 |
| 2013 | $1,448 | $19,170 | $5,260 | $13,910 |
Source: Public Records
Map
Nearby Homes
- 2387 29th St SW Unit 2389
- 1178 Welsh Ave
- 1237 Mcintosh Ave
- 1241 Mcintosh Ave
- 2301 East Ave
- 1107 W Wilbeth Rd
- 2278 26th St SW
- 1197 Carey Ave
- 2518 30th St SW
- 1392 Belcher Ave
- 2320 22nd St SW
- 1178 Florida Ave
- 2354 21st St SW
- 1223 Florida Ave
- 1174 Kohler Ave
- 1295 Kohler Ave
- 1266 Kohler Ave
- 2226 26th St SW
- 2248 East Ave
- 2236 24th St SW
- 1260 California Ave Unit 1262
- 1266 California Ave
- 1254 California Ave Unit 1258
- 1272 California Ave
- 1252 California Ave
- 1274 California Ave
- 1276 California Ave
- 1246 California Ave
- 1257 California Ave
- 1267 California Ave
- 1453 Kenmore Blvd
- 1449 Kenmore Blvd
- 1433 Kenmore Blvd
- 1433 Kenmore Blvd Unit B
- 1433 Kenmore Blvd Unit A
- 1427 Kenmore Blvd
- 1273 California Ave
- 1282 California Ave
- 1253 California Ave
- 1423 Kenmore Blvd