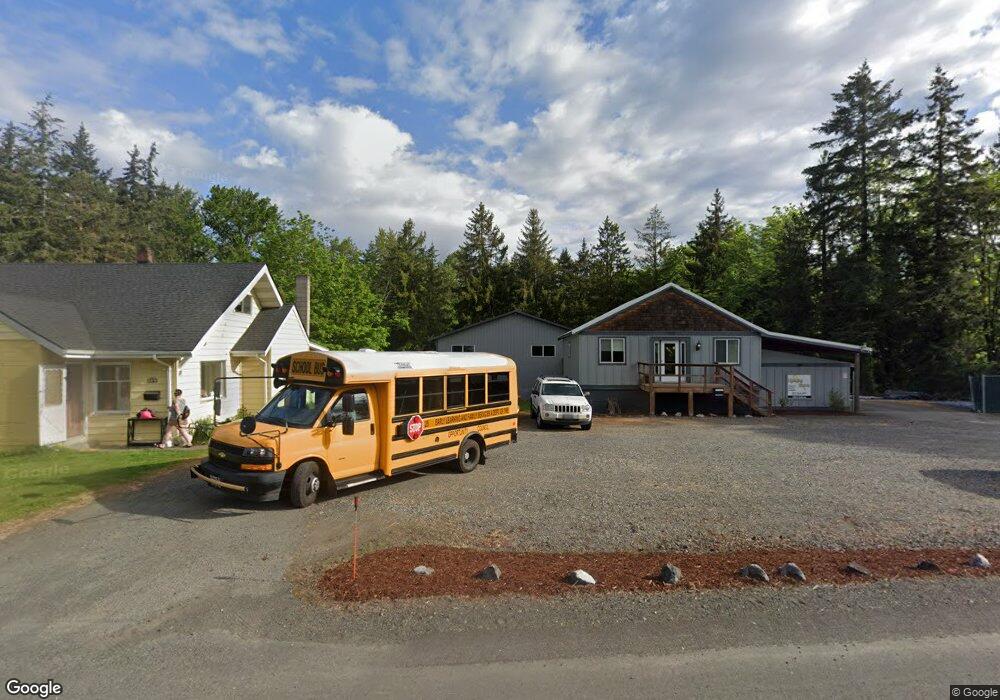
1262 E Smith Rd Bellingham, WA 98226
Estimated Value: $429,050 - $776,000
3
Beds
1
Bath
1,255
Sq Ft
$481/Sq Ft
Est. Value
About This Home
This home is located at 1262 E Smith Rd, Bellingham, WA 98226 and is currently estimated at $603,263, approximately $480 per square foot. 1262 E Smith Rd is a home located in Whatcom County with nearby schools including Irene Reither Elementary School, Meridian Middle School, and Meridian High School.
Ownership History
Date
Name
Owned For
Owner Type
Purchase Details
Closed on
Jun 7, 2021
Sold by
Vandiest Ronald Van
Bought by
Rvd Investments Llc
Current Estimated Value
Purchase Details
Closed on
Apr 10, 2021
Sold by
R A Property Investments Llc
Bought by
Vandiest Ronald Van
Purchase Details
Closed on
Apr 1, 2021
Sold by
R A Property Investments Llc
Bought by
Vandiest Ronald
Purchase Details
Closed on
Jun 16, 2008
Sold by
Dunn Shirley F
Bought by
R A Property Investments Llc
Home Financials for this Owner
Home Financials are based on the most recent Mortgage that was taken out on this home.
Original Mortgage
$250,000
Interest Rate
6%
Mortgage Type
Purchase Money Mortgage
Create a Home Valuation Report for This Property
The Home Valuation Report is an in-depth analysis detailing your home's value as well as a comparison with similar homes in the area
Purchase History
| Date | Buyer | Sale Price | Title Company |
|---|---|---|---|
| Rvd Investments Llc | -- | Whatcom Land Title Co Inc | |
| Vandiest Ronald Van | $313 | Accommodation/Courtesy Recordi | |
| Vandiest Ronald | -- | Accommodation | |
| R A Property Investments Llc | $275,280 | Chicago Title Insurance |
Source: Public Records
Mortgage History
| Date | Status | Borrower | Loan Amount |
|---|---|---|---|
| Previous Owner | R A Property Investments Llc | $250,000 |
Source: Public Records
Tax History
| Year | Tax Paid | Tax Assessment Tax Assessment Total Assessment is a certain percentage of the fair market value that is determined by local assessors to be the total taxable value of land and additions on the property. | Land | Improvement |
|---|---|---|---|---|
| 2025 | $5,100 | $584,540 | $278,564 | $305,976 |
| 2024 | $4,645 | $574,319 | $275,806 | $298,513 |
| 2023 | $4,645 | $591,966 | $315,610 | $276,356 |
| 2022 | $4,301 | $543,079 | $289,546 | $253,533 |
| 2021 | $3,856 | $424,276 | $226,206 | $198,070 |
| 2020 | $3,392 | $347,764 | $185,413 | $162,351 |
| 2019 | $3,052 | $306,406 | $163,362 | $143,044 |
| 2018 | $3,540 | $301,225 | $160,600 | $140,625 |
| 2017 | $3,145 | $266,119 | $132,825 | $133,294 |
| 2016 | $3,083 | $249,977 | $124,768 | $125,209 |
| 2014 | -- | $238,839 | $119,209 | $119,630 |
| 2013 | -- | $196,286 | $115,100 | $81,186 |
Source: Public Records
Map
Nearby Homes
- 5277 Stromer Rd
- 1242 E Smith Rd
- 5311 Market Rd
- 1295 E Smith Rd
- 1261 E Smith Rd
- 1298 E Smith Rd
- 1305 E Smith Rd
- 1210 E Smith Rd
- 5340 Market Rd
- 5361 Market Rd
- 1212 E Smith Rd
- 1283 E Smith Rd
- 1333 E Smith Rd
- 5381 Market Rd
- 1191 E Smith Rd
- 1184 E Smith Rd
- 1345 E Smith Rd
- 1161 E Smith Rd
- 1163 E Smith Rd
- 1317 E Smith Rd
Your Personal Tour Guide
Ask me questions while you tour the home.