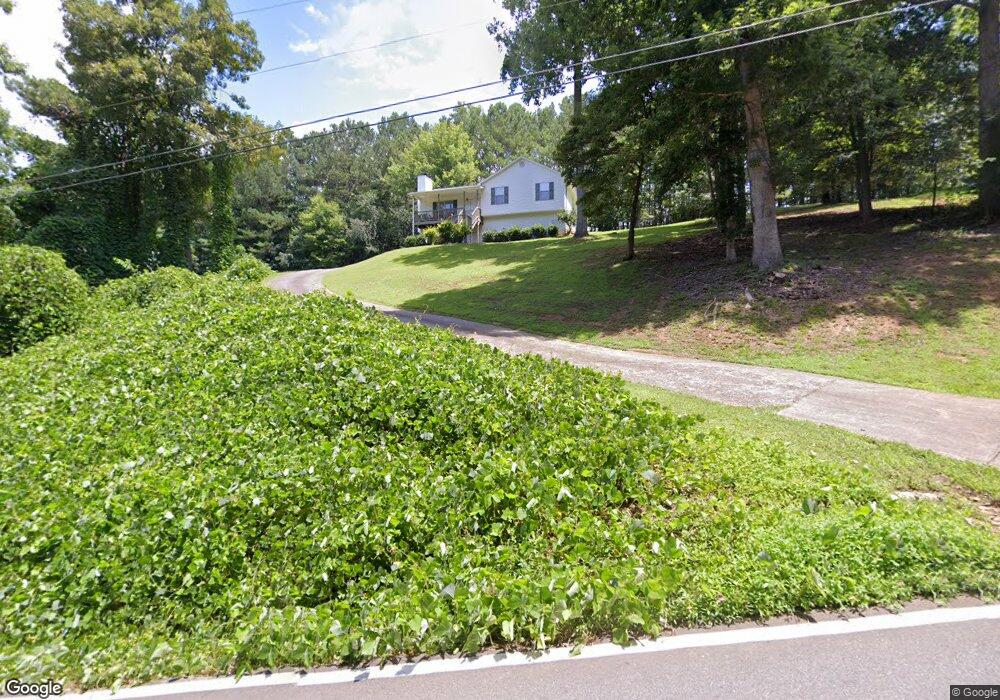
1262 Hobson Rd Jasper, GA 30143
Estimated Value: $289,000 - $318,000
3
Beds
2
Baths
1,204
Sq Ft
$252/Sq Ft
Est. Value
About This Home
This home is located at 1262 Hobson Rd, Jasper, GA 30143 and is currently estimated at $303,549, approximately $252 per square foot. 1262 Hobson Rd is a home located in Pickens County with nearby schools including Hill City Elementary School, Pickens County Middle School, and Pickens County High School.
Ownership History
Date
Name
Owned For
Owner Type
Purchase Details
Closed on
Mar 29, 2017
Sold by
Abaci Llc
Bought by
1262 Hsr Llc
Current Estimated Value
Purchase Details
Closed on
Sep 14, 2016
Sold by
Cheong K
Bought by
Abaci Llc
Purchase Details
Closed on
Mar 10, 2015
Sold by
Abaci Llc
Bought by
Phang Cheong K
Purchase Details
Closed on
Sep 30, 2010
Sold by
The Bank Of New York Mello
Bought by
Phang Cheong Kai
Purchase Details
Closed on
Oct 20, 2005
Sold by
Roark Michael J
Bought by
Clack David L
Home Financials for this Owner
Home Financials are based on the most recent Mortgage that was taken out on this home.
Original Mortgage
$97,280
Interest Rate
5.76%
Mortgage Type
New Conventional
Purchase Details
Closed on
Jul 5, 2005
Sold by
Simpson Janet V
Bought by
Roark Michael J
Purchase Details
Closed on
Apr 6, 1999
Sold by
Abbott Kenneth R
Bought by
Simpson Janet V
Purchase Details
Closed on
Jan 12, 1998
Bought by
Abbott Kenneth R
Create a Home Valuation Report for This Property
The Home Valuation Report is an in-depth analysis detailing your home's value as well as a comparison with similar homes in the area
Home Values in the Area
Average Home Value in this Area
Purchase History
| Date | Buyer | Sale Price | Title Company |
|---|---|---|---|
| 1262 Hsr Llc | -- | -- | |
| Abaci Llc | -- | -- | |
| Phang Cheong K | -- | -- | |
| Phang Cheong Kai | $90,000 | -- | |
| Clack David L | $121,600 | -- | |
| Roark Michael J | -- | -- | |
| Simpson Janet V | $85,500 | -- | |
| Abbott Kenneth R | $30,000 | -- |
Source: Public Records
Mortgage History
| Date | Status | Borrower | Loan Amount |
|---|---|---|---|
| Previous Owner | Clack David L | $97,280 | |
| Previous Owner | Clack David L | $24,320 |
Source: Public Records
Tax History Compared to Growth
Tax History
| Year | Tax Paid | Tax Assessment Tax Assessment Total Assessment is a certain percentage of the fair market value that is determined by local assessors to be the total taxable value of land and additions on the property. | Land | Improvement |
|---|---|---|---|---|
| 2024 | $1,839 | $92,924 | $16,000 | $76,924 |
| 2023 | $1,890 | $92,924 | $16,000 | $76,924 |
| 2022 | $1,098 | $54,009 | $10,000 | $44,009 |
| 2021 | $1,177 | $54,009 | $10,000 | $44,009 |
| 2020 | $1,212 | $54,009 | $10,000 | $44,009 |
| 2019 | $1,240 | $54,009 | $10,000 | $44,009 |
| 2018 | $1,252 | $54,009 | $10,000 | $44,009 |
| 2017 | $1,272 | $54,009 | $10,000 | $44,009 |
| 2016 | $1,031 | $43,078 | $10,000 | $33,078 |
| 2015 | $1,007 | $43,078 | $10,000 | $33,078 |
| 2014 | $1,009 | $43,078 | $10,000 | $33,078 |
| 2013 | -- | $43,078 | $10,000 | $33,078 |
Source: Public Records
Map
Nearby Homes
- 83 Quiet Water Ct
- Lot 10 Mill Creek Dr
- 001 Hobson Rd
- lot 1 Hobson Rd
- 164 Mill Creek Dr
- 255 Deer Run
- 101 Deer Trail
- 101 Deer Run
- 0 W Vista Ridge Pkwy Unit 415225
- 214 Lance Rd
- 138 White Pine Way
- Lot 219 Stone Cliff Dr
- 2 Village Ridge
- 0 Hidden Unit 10555951
- 0 Hidden Creek Rd Unit 7606543
- 0 Hidden Creek Rd Unit 10475738
- 200 Blue Haze Dr
- 312 Sterling Rd
- 471 & 475 Sterling Rd
- 303 Hobson Rd
- 1294 Hobson Rd
- 1230 Hobson Rd
- 91 Whispering Pebbles Trail
- 61 Whispering Pebbles Trail
- 117 Whispering Pebbles Trail
- 140 Mill Pond Ct
- 116 Mill Pond Ct
- 1188 Hobson Rd
- 1316 Hobson Rd
- 41 Whispering Waters Dr
- 180 Mill Pond Ct
- 84 Whispering Pebbles Trail
- 67 Whispering Pebbles Trail
- 67 Whispering Pebbles Trail Unit 67
- 43 Quiet Water Ct
- 116 Whispering Pebbles Trail
- 1332 Hobson Rd
- 0 Whispering Pebbles Trail Unit 3241736
- 0 Whispering Pebbles Trail Unit 3191100
- 0 Whispering Pebbles Trail Unit 7552923