1262 Tobey Dr Unit 1262 Columbus, OH 43230
Estimated Value: $183,000 - $212,000
2
Beds
2
Baths
901
Sq Ft
$220/Sq Ft
Est. Value
About This Home
This home is located at 1262 Tobey Dr Unit 1262, Columbus, OH 43230 and is currently estimated at $197,778, approximately $219 per square foot. 1262 Tobey Dr Unit 1262 is a home located in Franklin County with nearby schools including High Point Elementary School, Gahanna East Middle School, and Lincoln High School.
Ownership History
Date
Name
Owned For
Owner Type
Purchase Details
Closed on
Mar 30, 2022
Sold by
Shen Properties Llc
Bought by
Cr Fund 32 Llc
Current Estimated Value
Purchase Details
Closed on
May 26, 2015
Sold by
Di Properties Ltd
Bought by
Shen Properties Llc
Home Financials for this Owner
Home Financials are based on the most recent Mortgage that was taken out on this home.
Original Mortgage
$126,000
Interest Rate
3.65%
Mortgage Type
Future Advance Clause Open End Mortgage
Purchase Details
Closed on
Jul 16, 2002
Sold by
Triangle Properties Inc
Bought by
Di Properties Ltd
Home Financials for this Owner
Home Financials are based on the most recent Mortgage that was taken out on this home.
Original Mortgage
$129,600
Interest Rate
6.8%
Create a Home Valuation Report for This Property
The Home Valuation Report is an in-depth analysis detailing your home's value as well as a comparison with similar homes in the area
Home Values in the Area
Average Home Value in this Area
Purchase History
| Date | Buyer | Sale Price | Title Company |
|---|---|---|---|
| Cr Fund 32 Llc | $600,000 | Talon Title | |
| Shen Properties Llc | $180,000 | Stewart Title | |
| Di Properties Ltd | $158,600 | Midland Celtic Title |
Source: Public Records
Mortgage History
| Date | Status | Borrower | Loan Amount |
|---|---|---|---|
| Previous Owner | Shen Properties Llc | $126,000 | |
| Previous Owner | Di Properties Ltd | $129,600 |
Source: Public Records
Tax History Compared to Growth
Tax History
| Year | Tax Paid | Tax Assessment Tax Assessment Total Assessment is a certain percentage of the fair market value that is determined by local assessors to be the total taxable value of land and additions on the property. | Land | Improvement |
|---|---|---|---|---|
| 2024 | $3,008 | $50,050 | $10,500 | $39,550 |
| 2023 | $2,971 | $50,050 | $10,500 | $39,550 |
| 2022 | $1,792 | $23,520 | $3,430 | $20,090 |
| 2021 | $1,735 | $23,520 | $3,430 | $20,090 |
| 2020 | $1,721 | $23,520 | $3,430 | $20,090 |
| 2019 | $1,504 | $20,450 | $2,980 | $17,470 |
| 2018 | $1,359 | $20,450 | $2,980 | $17,470 |
| 2017 | $1,590 | $20,450 | $2,980 | $17,470 |
| 2016 | $1,509 | $20,300 | $2,800 | $17,500 |
| 2015 | $1,224 | $16,450 | $2,800 | $13,650 |
| 2014 | $1,214 | $16,450 | $2,800 | $13,650 |
| 2013 | -- | $16,450 | $2,800 | $13,650 |
Source: Public Records
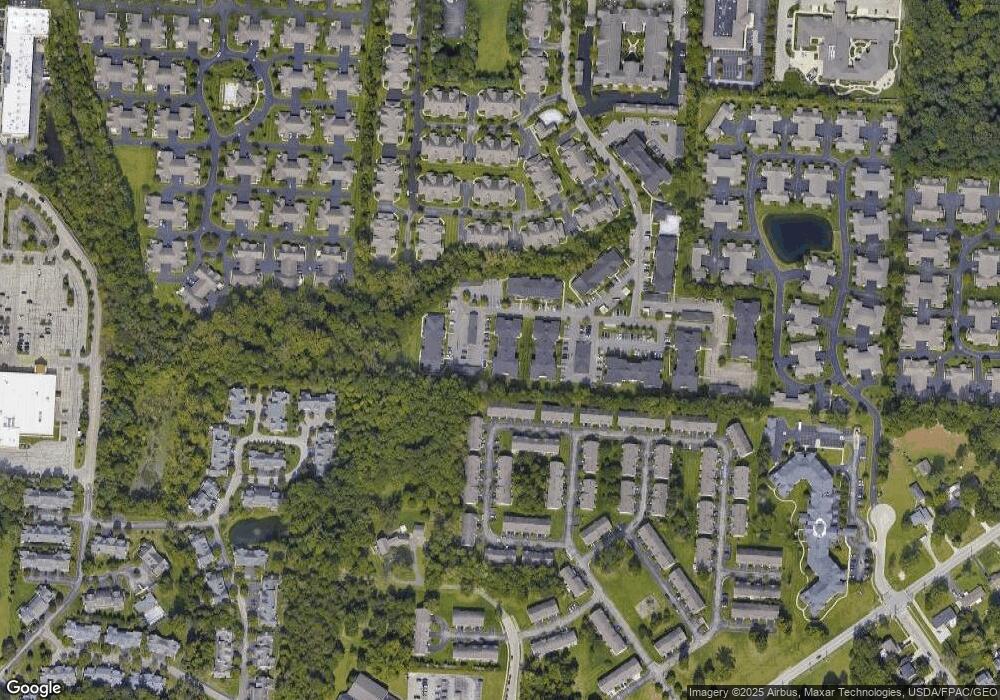
Map
Nearby Homes
- 597 Piney Glen Dr Unit 597
- 636 Grove Cir Unit 1803
- 1199 Riva Ridge Blvd
- 6019 Bentgate Ln Unit 60192
- 3753 Brightwell Ln
- 4574 N Hamilton Rd
- 6263 Wagtail Rd Unit 13
- 4651 E Johnstown Rd
- 6200 Downwing Ln Unit 20
- 6169 Needletail Rd
- 3826 Wood Stork Ln Unit 68
- 0 Beecher Crossing
- 777 Dark Star Ave
- 6232 Joes Hopper Rd Unit 52
- 4220 E Johnstown Rd
- 4135 Pathfield Dr
- 1035 Riva Ridge Blvd
- 3977 Spectacle Dr
- 4062 Summerstone Dr
- 638 Churchill Dr
- 1266 Tobey Dr Unit 1266
- 1254 Tobey Dr Unit 1254
- 1264 Tobey Dr
- 1260 Tobey Dr
- 1256 Tobey Dr
- 1274 Tobey Dr
- 1296 Tobey Dr
- 1292 Tobey Dr
- 1282 Tobey Dr
- 1258 Tobey Dr Unit 1258
- 1298 Tobey Dr
- 1294 Tobey Dr
- 1284 Tobey Dr
- 1278 Tobey Dr
- 1280 Tobey Dr
- 1276 Tobey Dr
- 1286 Tobey Dr
- 1290 Tobey Dr Unit 1290
- 1270 Tobey Dr
- 1288 Tobey Dr