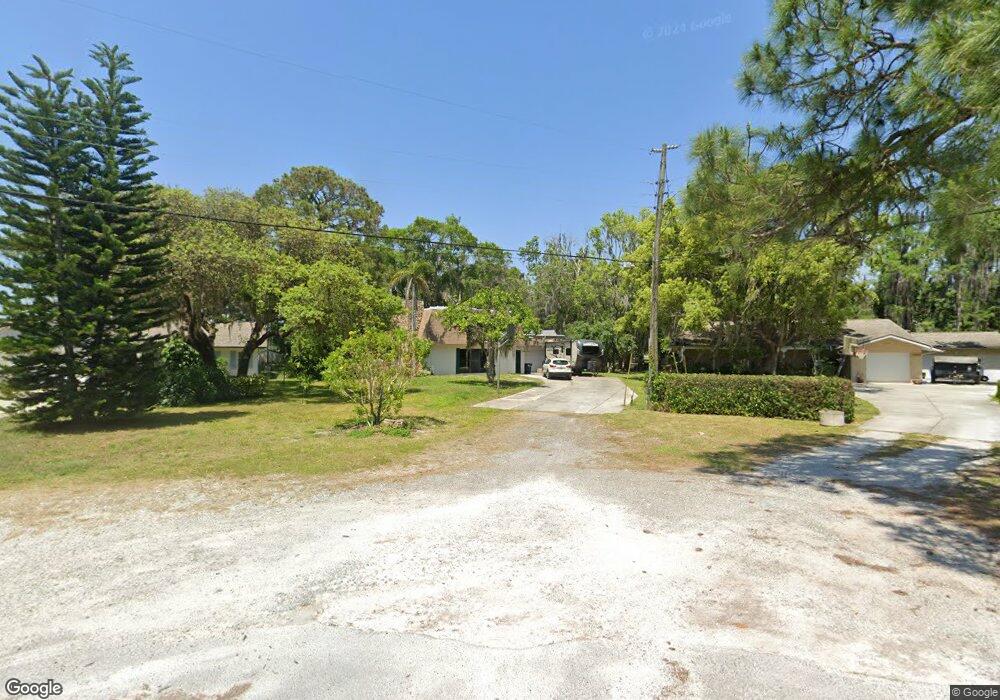
12621 Lacey Dr New Port Richey, FL 34654
Moon Lake Estates NeighborhoodEstimated Value: $311,000 - $372,000
3
Beds
2
Baths
2,570
Sq Ft
$132/Sq Ft
Est. Value
About This Home
This home is located at 12621 Lacey Dr, New Port Richey, FL 34654 and is currently estimated at $339,222, approximately $131 per square foot. 12621 Lacey Dr is a home located in Pasco County with nearby schools including River Ridge High School, Cypress Elementary School, and River Ridge Middle School.
Ownership History
Date
Name
Owned For
Owner Type
Purchase Details
Closed on
Dec 29, 2021
Sold by
Advanta Ira Services Llc
Bought by
Advanta Ira Services Llc
Current Estimated Value
Purchase Details
Closed on
Feb 6, 2020
Sold by
Advanta Ira Services Llc
Bought by
Advanta Ira Services Llc and Ira 8001844
Purchase Details
Closed on
Jun 20, 2013
Sold by
Bryan Nancy
Bought by
Advanta Ira Services Llc and Ira #800184
Purchase Details
Closed on
Apr 29, 2005
Sold by
Ayers Lance Heath
Bought by
Bryan Nancy and Ayers Nancy Bryan
Purchase Details
Closed on
Oct 13, 1998
Sold by
Kincheloe Calvin H and Kincheloe Sue H
Bought by
Bryan Nancy
Purchase Details
Closed on
May 10, 1996
Sold by
Moon Lake Realty And Development
Bought by
Kincheloe Calvin H and Kincheloe Sue H
Create a Home Valuation Report for This Property
The Home Valuation Report is an in-depth analysis detailing your home's value as well as a comparison with similar homes in the area
Home Values in the Area
Average Home Value in this Area
Purchase History
| Date | Buyer | Sale Price | Title Company |
|---|---|---|---|
| Advanta Ira Services Llc | $24,700 | None Listed On Document | |
| Advanta Ira Services Llc | $25,000 | None Available | |
| Advanta Ira Services Llc | $125,000 | Master Title Services Inc | |
| Bryan Nancy | -- | -- | |
| Bryan Nancy | $110,000 | -- | |
| Kincheloe Calvin H | $100 | -- |
Source: Public Records
Mortgage History
| Date | Status | Borrower | Loan Amount |
|---|---|---|---|
| Previous Owner | Kincheloe Calvin H | $100,000 |
Source: Public Records
Tax History Compared to Growth
Tax History
| Year | Tax Paid | Tax Assessment Tax Assessment Total Assessment is a certain percentage of the fair market value that is determined by local assessors to be the total taxable value of land and additions on the property. | Land | Improvement |
|---|---|---|---|---|
| 2025 | $4,791 | $328,971 | $81,634 | $247,337 |
| 2024 | $4,791 | $332,452 | $81,634 | $250,818 |
| 2023 | $4,451 | $209,790 | $0 | $0 |
| 2022 | $3,533 | $248,420 | $69,892 | $178,528 |
| 2021 | $3,143 | $201,450 | $63,804 | $137,646 |
| 2020 | $2,850 | $178,897 | $63,804 | $115,093 |
| 2019 | $2,723 | $177,675 | $63,804 | $113,871 |
| 2018 | $2,304 | $130,274 | $63,804 | $66,470 |
| 2017 | $2,277 | $126,151 | $63,804 | $62,347 |
| 2016 | $2,220 | $123,387 | $63,804 | $59,583 |
| 2015 | $2,209 | $120,139 | $63,804 | $56,335 |
| 2014 | $2,122 | $117,655 | $63,804 | $53,851 |
Source: Public Records
Map
Nearby Homes
- 00 Poppy St
- 8977 Lake Dr
- 00 Valimar Rd
- 8976 Lake Dr
- 12629 Lacey Dr
- 0 Tinley Lots 71 72 & 73 Unit MFRW7877924
- 12305 Moon Lake Cir
- 0 El Dorado Ave Unit MFRW7869403
- 12905 Casa Bianca Ave
- 0 Casa Bianca Ave
- 12845 Casa Bianca Ave
- 12419 Lamont Ave
- 12338 Terra Ceia Ave
- 0 Carver Unit MFRTB8409821
- 0 Ladd Ave Unit MFRW7876691
- 0 Estelle St Unit MFRW7863399
- 12236 Terra Ceia Ave
- 00 Ladd Ave
- TBD Ladd Ave
- 12410 Clear Lake Dr
- 12615 Lacey Dr
- 12609 Lacey Dr
- 8725 Marigold Dr
- 12625 Lacey Dr
- 12601 Lacey Dr
- 12612 Lacey Dr
- 8726 Marigold Dr
- 8731 Marigold Dr
- 0 Marigold Dr Unit W7329495
- 0 Marigold Unit 6& 7 W7329487
- 0 Marigold Dr Unit MFRW7859688
- 12571 Lacey Dr
- 12645 Lacey Dr
- 12600 Lacey Dr
- 12589 Mountain Rd
- 12601 Mountain Rd
- 8735 Marigold Dr
- 12665 Lacey Dr
- 12651 Wildrose Ave
- 8748 Marigold Dr