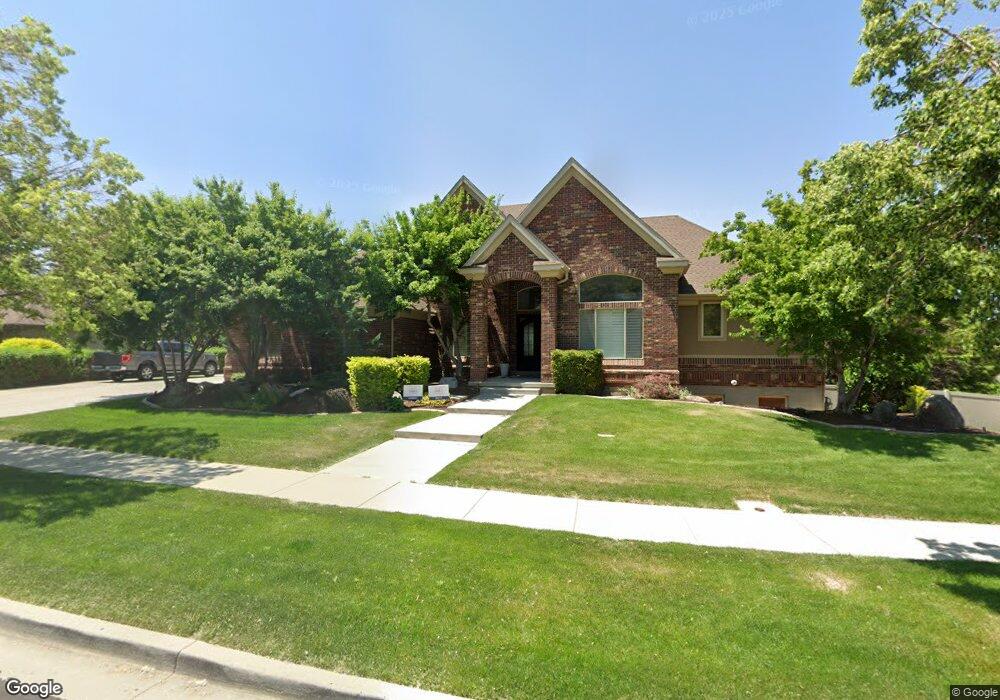
12622 Wilding Way Draper, UT 84020
Estimated Value: $1,267,000 - $1,821,000
4
Beds
4
Baths
3,715
Sq Ft
$436/Sq Ft
Est. Value
About This Home
This home is located at 12622 Wilding Way, Draper, UT 84020 and is currently estimated at $1,618,086, approximately $435 per square foot. 12622 Wilding Way is a home located in Salt Lake County with nearby schools including Draper Park Middle School, Corner Canyon High School, and Summit Academy - Draper Elementary Campus.
Ownership History
Date
Name
Owned For
Owner Type
Purchase Details
Closed on
May 13, 2006
Sold by
Harbertson Scott and Harbertson Megan
Bought by
Harbertson Scott M and Harbertson Megan C
Current Estimated Value
Home Financials for this Owner
Home Financials are based on the most recent Mortgage that was taken out on this home.
Original Mortgage
$175,000
Outstanding Balance
$101,411
Interest Rate
6.41%
Mortgage Type
Stand Alone Second
Estimated Equity
$1,516,675
Purchase Details
Closed on
Oct 25, 2004
Sold by
Elk Ridge Development Inc
Bought by
Harbertson Scott and Harbertson Megan
Home Financials for this Owner
Home Financials are based on the most recent Mortgage that was taken out on this home.
Original Mortgage
$90,000
Interest Rate
5.82%
Mortgage Type
Seller Take Back
Create a Home Valuation Report for This Property
The Home Valuation Report is an in-depth analysis detailing your home's value as well as a comparison with similar homes in the area
Home Values in the Area
Average Home Value in this Area
Purchase History
| Date | Buyer | Sale Price | Title Company |
|---|---|---|---|
| Harbertson Scott M | -- | Metro National Title | |
| Harbertson Scott | -- | Landmark Title |
Source: Public Records
Mortgage History
| Date | Status | Borrower | Loan Amount |
|---|---|---|---|
| Open | Harbertson Scott M | $175,000 | |
| Open | Harbertson Scott M | $645,000 | |
| Closed | Harbertson Scott | $90,000 |
Source: Public Records
Tax History Compared to Growth
Tax History
| Year | Tax Paid | Tax Assessment Tax Assessment Total Assessment is a certain percentage of the fair market value that is determined by local assessors to be the total taxable value of land and additions on the property. | Land | Improvement |
|---|---|---|---|---|
| 2025 | $7,479 | $1,541,000 | $515,900 | $1,025,100 |
| 2024 | $7,479 | $1,428,600 | $504,800 | $923,800 |
| 2023 | $6,977 | $1,323,000 | $396,500 | $926,500 |
| 2022 | $7,224 | $1,323,100 | $388,800 | $934,300 |
| 2021 | $6,679 | $1,045,000 | $324,000 | $721,000 |
| 2020 | $6,493 | $963,000 | $321,600 | $641,400 |
| 2019 | $6,488 | $940,200 | $319,300 | $620,900 |
| 2018 | $6,004 | $889,300 | $282,300 | $607,000 |
| 2017 | $5,766 | $818,100 | $282,300 | $535,800 |
| 2016 | $5,850 | $806,700 | $282,300 | $524,400 |
| 2015 | $5,670 | $723,900 | $232,500 | $491,400 |
| 2014 | $5,450 | $679,800 | $218,600 | $461,200 |
Source: Public Records
Map
Nearby Homes
- 12838 Hickory Ridge Ln
- 12882 S Ellerbeck Ln Unit 12882
- 2019 E Graystone Ct
- 12182 S Pine Valley Way
- 2026 E Tivoli Hills Ct
- 1644 Pebble Beach Cir
- 12671 S Somerdowns Ct
- 13050 S 1300 E
- 1481 Noelle Rd
- 13353 S Peach Orchard Ct
- 11966 Bluff View Dr
- 11778 S 1700 E
- 1137 Parkstone Dr
- 2412 Bear Hill Dr S
- 13307 S 1300 E
- 11922 S Bluff View Dr
- 1201 E 13200 S Unit 4
- 11989 S Hidden Valley Dr
- 1612 E Hidden Valley Rd
- 1937 Wasatch Blvd
- 12617 S 1840 E
- 12621 S Bear Meadow Ct
- 12621 Bear Meadow Ct
- 12646 Wilding Way
- 12646 S Wilding Way
- 12643 Bear Meadow Ct
- 12643 S Bear Meadow Ct
- 1843 Stag Ridge Dr
- 1843 E Stag Ridge Dr
- 12611 Wilding Way
- 12611 S Wilding Way
- 12562 S 1840 E
- 12587 S Deer Canyon Ln
- 12587 Deer Canyon Ln
- 12563 S 1840 E
- 12563 S 1840 E Unit 104
- 12668 S Wilding Way
- 12668 Wilding Way
- 1842 E Stag Ridge Dr
- 1842 Stag Ridge Dr