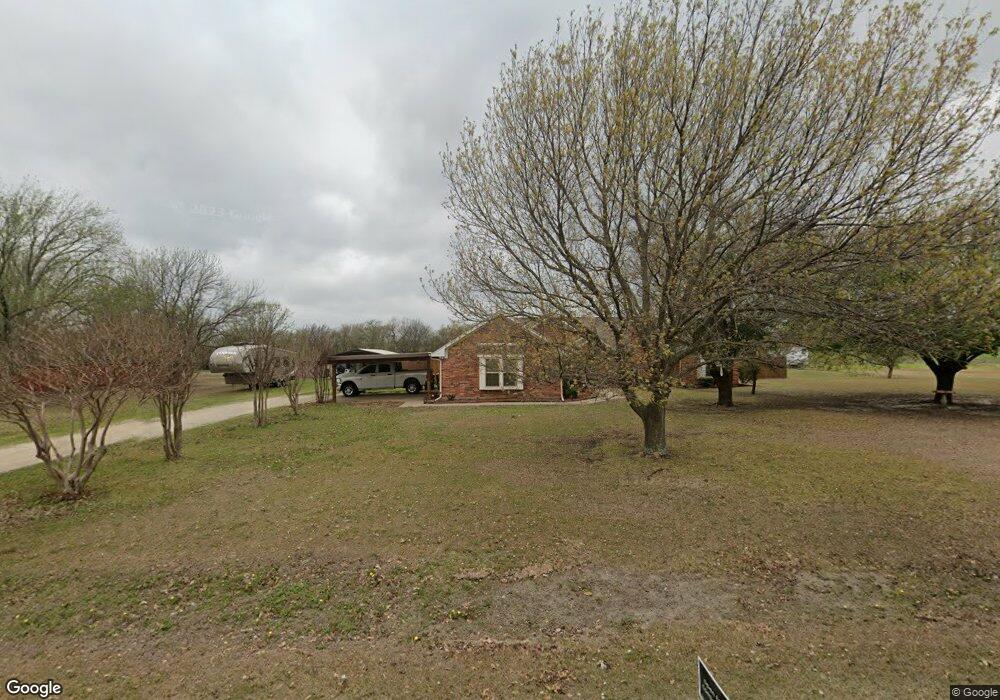
12624 Mallard Rd Sanger, TX 76266
Estimated Value: $391,172 - $508,000
3
Beds
2
Baths
1,714
Sq Ft
$263/Sq Ft
Est. Value
About This Home
This home is located at 12624 Mallard Rd, Sanger, TX 76266 and is currently estimated at $450,293, approximately $262 per square foot. 12624 Mallard Rd is a home located in Denton County with nearby schools including Chisholm Trail Elementary School, Clear Creek Intermediate School, and Sanger Sixth Grade Campus.
Ownership History
Date
Name
Owned For
Owner Type
Purchase Details
Closed on
Oct 15, 2010
Sold by
Knabe Tracy Erin
Bought by
Knabe Jonathan Lawrence
Current Estimated Value
Purchase Details
Closed on
May 30, 2007
Sold by
Brockett David A and Brockett Rhonda A
Bought by
Knabe Jonathan and Wood Tracy
Home Financials for this Owner
Home Financials are based on the most recent Mortgage that was taken out on this home.
Original Mortgage
$162,000
Outstanding Balance
$99,020
Interest Rate
6.17%
Mortgage Type
Purchase Money Mortgage
Estimated Equity
$351,273
Purchase Details
Closed on
Jul 9, 1999
Sold by
Johnson Donald R and Johnson Joann
Bought by
Brockett David A and Brockett Rhonda A
Home Financials for this Owner
Home Financials are based on the most recent Mortgage that was taken out on this home.
Original Mortgage
$90,000
Interest Rate
7.21%
Create a Home Valuation Report for This Property
The Home Valuation Report is an in-depth analysis detailing your home's value as well as a comparison with similar homes in the area
Home Values in the Area
Average Home Value in this Area
Purchase History
| Date | Buyer | Sale Price | Title Company |
|---|---|---|---|
| Knabe Jonathan Lawrence | -- | None Available | |
| Knabe Jonathan | -- | Title Resources Of North Tex | |
| Brockett David A | -- | -- |
Source: Public Records
Mortgage History
| Date | Status | Borrower | Loan Amount |
|---|---|---|---|
| Open | Knabe Jonathan | $162,000 | |
| Previous Owner | Brockett David A | $90,000 | |
| Closed | Knabe Jonathan Lawrence | $0 |
Source: Public Records
Tax History Compared to Growth
Tax History
| Year | Tax Paid | Tax Assessment Tax Assessment Total Assessment is a certain percentage of the fair market value that is determined by local assessors to be the total taxable value of land and additions on the property. | Land | Improvement |
|---|---|---|---|---|
| 2025 | $3,209 | $308,000 | $77,500 | $230,500 |
| 2024 | $4,362 | $321,372 | $0 | $0 |
| 2023 | $2,831 | $292,156 | $75,000 | $343,286 |
| 2022 | $4,405 | $265,596 | $87,120 | $204,428 |
| 2021 | $3,523 | $241,451 | $58,806 | $182,645 |
| 2020 | $3,543 | $225,500 | $58,806 | $185,201 |
| 2019 | $3,355 | $205,000 | $58,806 | $146,194 |
| 2018 | $3,034 | $184,000 | $58,806 | $125,194 |
| 2017 | $2,944 | $177,309 | $58,806 | $146,904 |
| 2016 | $2,677 | $161,190 | $39,204 | $121,986 |
| 2015 | $2,343 | $156,767 | $39,204 | $117,563 |
| 2013 | -- | $148,451 | $39,204 | $109,247 |
Source: Public Records
Map
Nearby Homes
- 11087 Chisum Rd
- 7240 Hunnington Dr
- 6810 Hunnington Dr
- 9715 Fm 2450
- 000 Fm 2450
- 8623 Chisum Rd
- TBD Cashs Mill Rd
- 13709 Cash Mill Rd
- 13721 Cash Mill Rd
- 13743 Cashs Mill
- 12142 Fm 2450
- 59.66 Rd
- 90.54 + Unit ACRES 14134 Cashs
- 14134 Cashs Mill Rd
- 6362 Belz Rd
- 6298 Belz Rd
- 11007 Farm To Market Road 2450
- 10916 Fm 2450
- 6000 Fm 455 W
- 10902 Clear Creek Rd W
- 12560 Mallard Rd
- 12666 Mallard Rd
- 12601 Mallard Rd
- 12563 Mallard Rd
- 12659 Mallard Rd
- 12716 Mallard Rd
- 12538 Mallard Rd
- 12519 Mallard Rd
- 12721 Mallard Rd
- Lot 5 Chisum Rd
- 10320 Chisum Rd
- Lot 8 Chisum Rd
- Lot 6 Chisum Rd
- Lot 7 Chisum Rd
- 12521 Cashs Mill Rd
- 10406 Chisum Rd
- 10284 Chisum Rd
- 10488 Chisum Rd
- 12553 Cashs Mill Rd
- 12573 Cashs Mill Rd