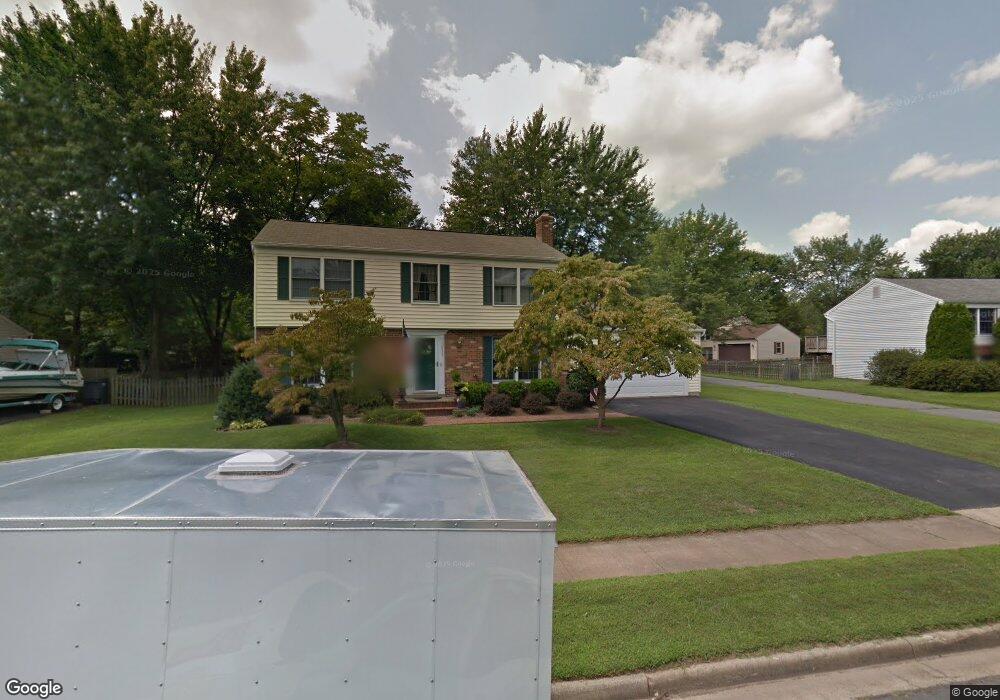
12627 Etruscan Dr Herndon, VA 20171
Oak Hill NeighborhoodEstimated Value: $818,326 - $856,000
4
Beds
3
Baths
2,700
Sq Ft
$308/Sq Ft
Est. Value
About This Home
This home is located at 12627 Etruscan Dr, Herndon, VA 20171 and is currently estimated at $831,332, approximately $307 per square foot. 12627 Etruscan Dr is a home located in Fairfax County with nearby schools including Fox Mill Elementary School, Rachel Carson Middle School, and South Lakes High School.
Ownership History
Date
Name
Owned For
Owner Type
Purchase Details
Closed on
Aug 12, 2010
Sold by
Thorpe Rodney L
Bought by
Atkins Craig A
Current Estimated Value
Home Financials for this Owner
Home Financials are based on the most recent Mortgage that was taken out on this home.
Original Mortgage
$320,000
Outstanding Balance
$212,511
Interest Rate
4.63%
Mortgage Type
New Conventional
Estimated Equity
$618,821
Purchase Details
Closed on
Apr 17, 2000
Sold by
Crawford James B
Bought by
Thorpe Rodney L
Home Financials for this Owner
Home Financials are based on the most recent Mortgage that was taken out on this home.
Original Mortgage
$193,600
Interest Rate
8.26%
Purchase Details
Closed on
May 2, 1994
Sold by
Forman Gary D
Bought by
Crawford James B
Home Financials for this Owner
Home Financials are based on the most recent Mortgage that was taken out on this home.
Original Mortgage
$151,200
Interest Rate
7.7%
Create a Home Valuation Report for This Property
The Home Valuation Report is an in-depth analysis detailing your home's value as well as a comparison with similar homes in the area
Home Values in the Area
Average Home Value in this Area
Purchase History
| Date | Buyer | Sale Price | Title Company |
|---|---|---|---|
| Atkins Craig A | $450,000 | -- | |
| Thorpe Rodney L | $242,000 | -- | |
| Crawford James B | $190,400 | -- |
Source: Public Records
Mortgage History
| Date | Status | Borrower | Loan Amount |
|---|---|---|---|
| Open | Atkins Craig A | $320,000 | |
| Previous Owner | Thorpe Rodney L | $193,600 | |
| Previous Owner | Crawford James B | $151,200 |
Source: Public Records
Tax History Compared to Growth
Tax History
| Year | Tax Paid | Tax Assessment Tax Assessment Total Assessment is a certain percentage of the fair market value that is determined by local assessors to be the total taxable value of land and additions on the property. | Land | Improvement |
|---|---|---|---|---|
| 2025 | $7,930 | $789,230 | $310,000 | $479,230 |
| 2024 | $7,930 | $684,500 | $285,000 | $399,500 |
| 2023 | $7,630 | $676,090 | $285,000 | $391,090 |
| 2022 | $7,291 | $637,610 | $255,000 | $382,610 |
| 2021 | $6,707 | $571,520 | $220,000 | $351,520 |
| 2020 | $6,502 | $549,360 | $220,000 | $329,360 |
| 2019 | $6,552 | $553,650 | $220,000 | $333,650 |
| 2018 | $6,000 | $521,760 | $210,000 | $311,760 |
| 2017 | $5,817 | $501,000 | $210,000 | $291,000 |
| 2016 | $5,702 | $492,190 | $210,000 | $282,190 |
| 2015 | $5,794 | $519,190 | $210,000 | $309,190 |
| 2014 | $5,471 | $491,290 | $205,000 | $286,290 |
Source: Public Records
Map
Nearby Homes
- 12402 Brown Fox Way
- 2442 Arctic Fox Way
- 2410 Dakota Lakes Dr
- 2629 New Banner Ln
- 12768 Sunrise Valley Dr
- 12388 Copenhagen Ct
- 13133 Park Crescent Cir
- 13083 Rose Petal Cir
- 13103 Anvil Place
- 12925 Centre Park Cir Unit 311
- 12925 Centre Park Cir Unit 304
- 13032 Monterey Estates Dr
- 12968 Wood Crescent Cir
- 12945 Centre Park Cir Unit 208
- 12945 Centre Park Cir Unit 110
- 2317 Freetown Ct Unit 2B
- 12933 Centre Park Cir Unit 305
- 13056 Marcey Creek Rd Unit 13056
- 12957 Centre Park Cir Unit 110
- 12953 Centre Park Cir Unit 222
- 12625 Etruscan Dr
- 12633 Etruscan Dr
- 12631 Etruscan Dr
- 12623 Etruscan Dr
- 12628 Etruscan Dr
- 12626 Etruscan Dr
- 12630 Etruscan Dr
- 12635 Etruscan Dr
- 12628 Holkein Dr
- 12630 Holkein Dr
- 12626 Holkein Dr
- 12624 Etruscan Dr
- 12622 Holkein Dr
- 12632 Holkein Dr
- 12621 Etruscan Dr
- 12634 Etruscan Dr
- 12620 Holkein Dr
- 12620 Etruscan Dr
- 12636 Etruscan Dr
- 12637 Etruscan Dr