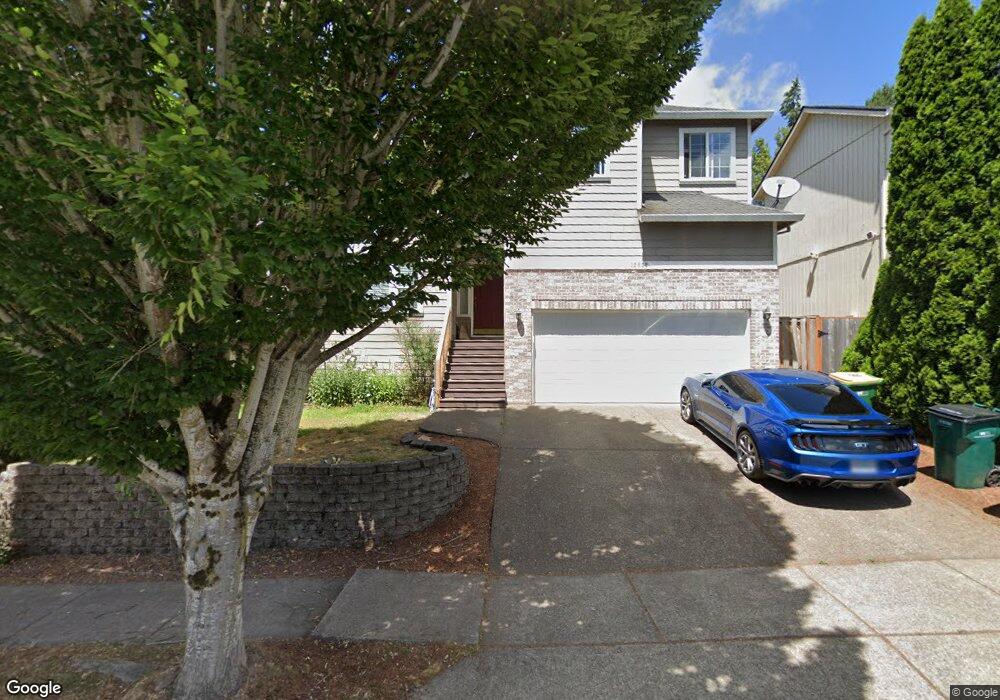
12632 SW Canvasback Way Beaverton, OR 97007
Neighbors Southwest NeighborhoodEstimated Value: $649,686 - $696,000
5
Beds
3
Baths
2,500
Sq Ft
$272/Sq Ft
Est. Value
About This Home
This home is located at 12632 SW Canvasback Way, Beaverton, OR 97007 and is currently estimated at $679,922, approximately $271 per square foot. 12632 SW Canvasback Way is a home located in Washington County with nearby schools including Scholls Heights Elementary School, Conestoga Middle School, and Mountainside High School.
Ownership History
Date
Name
Owned For
Owner Type
Purchase Details
Closed on
Jul 19, 2012
Sold by
Myerscough Matthew Todd and Palamand Shaila
Bought by
Kumar Amit and Devi Kirti
Current Estimated Value
Home Financials for this Owner
Home Financials are based on the most recent Mortgage that was taken out on this home.
Original Mortgage
$228,750
Outstanding Balance
$156,618
Interest Rate
3.65%
Mortgage Type
New Conventional
Estimated Equity
$523,304
Purchase Details
Closed on
May 16, 2011
Sold by
Brown Joyce W
Bought by
Palamand Shaila and Myerscough Matthew Todd
Purchase Details
Closed on
Jul 12, 1999
Sold by
Wangsgard Scott and Wangsgard Scott M
Bought by
Wangsgard Richard and Scott M Wangsgard Family Trust
Purchase Details
Closed on
Dec 9, 1997
Sold by
Pacific Ridge Inc
Bought by
Wangsgard Scott M
Home Financials for this Owner
Home Financials are based on the most recent Mortgage that was taken out on this home.
Original Mortgage
$129,000
Interest Rate
7.22%
Create a Home Valuation Report for This Property
The Home Valuation Report is an in-depth analysis detailing your home's value as well as a comparison with similar homes in the area
Home Values in the Area
Average Home Value in this Area
Purchase History
| Date | Buyer | Sale Price | Title Company |
|---|---|---|---|
| Kumar Amit | $305,000 | Ticor Title | |
| Palamand Shaila | $290,000 | Ticor Title | |
| Brown Joyce W | -- | Ticor Title | |
| Wangsgard Richard | -- | -- | |
| Wangsgard Scott M | $206,897 | First American Title Ins Co |
Source: Public Records
Mortgage History
| Date | Status | Borrower | Loan Amount |
|---|---|---|---|
| Open | Kumar Amit | $228,750 | |
| Previous Owner | Wangsgard Scott M | $129,000 |
Source: Public Records
Tax History Compared to Growth
Tax History
| Year | Tax Paid | Tax Assessment Tax Assessment Total Assessment is a certain percentage of the fair market value that is determined by local assessors to be the total taxable value of land and additions on the property. | Land | Improvement |
|---|---|---|---|---|
| 2026 | $8,802 | $429,700 | -- | -- |
| 2025 | $8,802 | $417,190 | -- | -- |
| 2024 | $8,310 | $405,040 | -- | -- |
| 2023 | $8,310 | $393,250 | $0 | $0 |
| 2022 | $7,954 | $393,250 | $0 | $0 |
| 2021 | $7,675 | $370,680 | $0 | $0 |
| 2020 | $7,442 | $359,890 | $0 | $0 |
| 2019 | $7,206 | $349,410 | $0 | $0 |
| 2018 | $6,977 | $339,240 | $0 | $0 |
| 2017 | $6,716 | $329,360 | $0 | $0 |
| 2016 | $6,482 | $319,770 | $0 | $0 |
| 2015 | $6,241 | $310,460 | $0 | $0 |
| 2014 | $6,108 | $301,420 | $0 | $0 |
Source: Public Records
Map
Nearby Homes
- 16140 SW Puffin Ct
- 12697 SW Canvasback Way
- 12365 Curlew Way
- 12450 Curlew Way
- Sellwood Plan at Heights at Cooper Mountain
- Burlington Plan at Heights at Cooper Mountain
- Bainbridge Plan at Heights at Cooper Mountain
- Jade Plan at Heights at Cooper Mountain
- Pecan Plan at Heights at Cooper Mountain
- Endicott Plan at Heights at Cooper Mountain
- Ashley Plan at Heights at Cooper Mountain
- Magnolia Plan at Heights at Cooper Mountain
- Hazel Plan at Heights at Cooper Mountain
- Cambridge Plan at Heights at Cooper Mountain
- Ivy Plan at Heights at Cooper Mountain
- Alpine Plan at Heights at Cooper Mountain
- Marigold Plan at Heights at Cooper Mountain
- 12263 SW Bittern Terrace
- 12258 SW Bittern Terrace
- 12190 SW Bittern Terrace
- 12628 SW Canvasback Way
- 12640 SW Canvasback Way
- 12616 SW Canvasback Way
- 12652 SW Canvasback Way
- 12575 SW Canvasback Way
- 12643 SW Canvasback Way
- 12668 SW Canvasback Way
- 12608 SW Canvasback Way
- 12563 SW Canvasback Way
- 12655 SW Canvasback Way
- 12592 SW Canvasback Way
- 12580 SW Canvasback Way
- 12672 SW Canvasback Way
- 12574 SW Canvasback Way
- 12559 SW Canvasback Way
- 16045 SW Goldeneye Ct
- 12568 SW Canvasback Way
- 12663 SW Canvasback Way
- 16160 SW Puffin Ct
- 12552 SW Canvasback Way