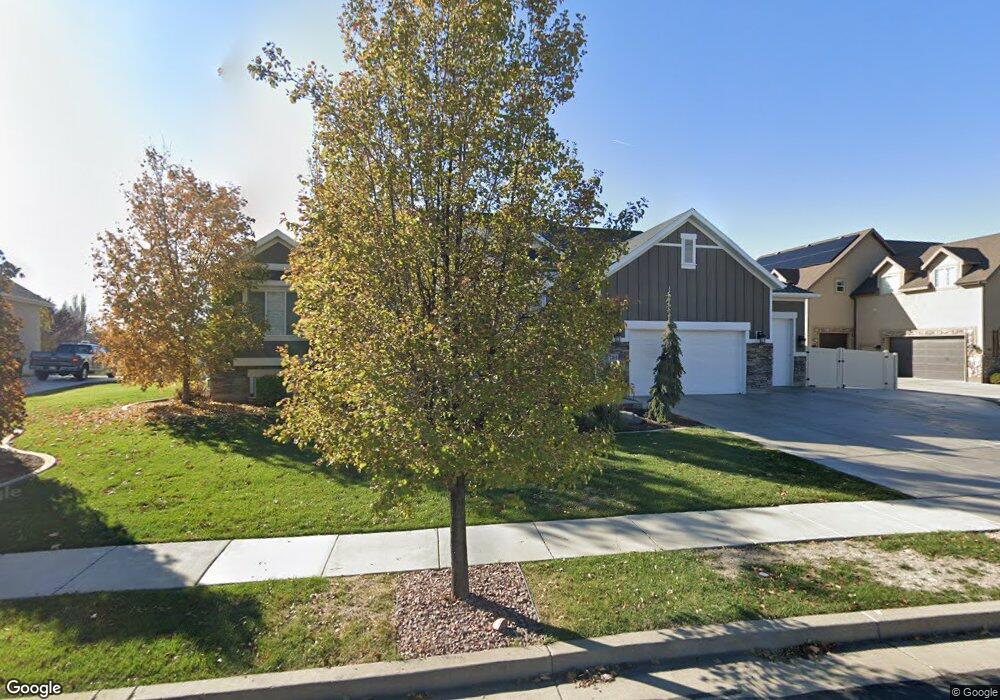
1264 Derby Ct Unit 202 Kaysville, UT 84037
West Kaysville NeighborhoodEstimated Value: $1,043,000 - $1,343,000
4
Beds
3
Baths
2,425
Sq Ft
$491/Sq Ft
Est. Value
About This Home
This home is located at 1264 Derby Ct Unit 202, Kaysville, UT 84037 and is currently estimated at $1,191,591, approximately $491 per square foot. 1264 Derby Ct Unit 202 is a home located in Davis County with nearby schools including Snow Horse School, Farmington High, and Centennial Junior High School.
Ownership History
Date
Name
Owned For
Owner Type
Purchase Details
Closed on
Dec 12, 2012
Sold by
Havenhill Homes Llc
Bought by
Bentley Blake W and Bentley Elizabeth A
Current Estimated Value
Home Financials for this Owner
Home Financials are based on the most recent Mortgage that was taken out on this home.
Original Mortgage
$417,000
Outstanding Balance
$287,609
Interest Rate
3.35%
Mortgage Type
New Conventional
Estimated Equity
$903,982
Purchase Details
Closed on
Jun 20, 2012
Sold by
Cockerham Brenda
Bought by
Havenhill Homes Llc
Home Financials for this Owner
Home Financials are based on the most recent Mortgage that was taken out on this home.
Original Mortgage
$352,400
Interest Rate
3.77%
Mortgage Type
Construction
Purchase Details
Closed on
Jan 21, 2010
Sold by
United Land Reserve Llc
Bought by
Cockerham Brenda
Purchase Details
Closed on
Jul 30, 2009
Sold by
3B Sqaure Llc
Bought by
United Land Reserve
Purchase Details
Closed on
Sep 19, 2006
Sold by
Woodside Sunset Farms Llc
Bought by
Bates Dee D
Create a Home Valuation Report for This Property
The Home Valuation Report is an in-depth analysis detailing your home's value as well as a comparison with similar homes in the area
Home Values in the Area
Average Home Value in this Area
Purchase History
| Date | Buyer | Sale Price | Title Company |
|---|---|---|---|
| Bentley Blake W | -- | North American Title | |
| Havenhill Homes Llc | -- | North American Titl | |
| Cockerham Brenda | -- | Brighton Title | |
| United Land Reserve | -- | Brighton Title | |
| Bates Dee D | -- | Us Title Company Of Utah | |
| 3B Square Llc | -- | Meridian Title Company |
Source: Public Records
Mortgage History
| Date | Status | Borrower | Loan Amount |
|---|---|---|---|
| Open | Bentley Blake W | $417,000 | |
| Previous Owner | Havenhill Homes Llc | $352,400 |
Source: Public Records
Tax History Compared to Growth
Tax History
| Year | Tax Paid | Tax Assessment Tax Assessment Total Assessment is a certain percentage of the fair market value that is determined by local assessors to be the total taxable value of land and additions on the property. | Land | Improvement |
|---|---|---|---|---|
| 2025 | $5,638 | $609,400 | $225,324 | $384,076 |
| 2024 | $5,638 | $594,550 | $216,036 | $378,514 |
| 2023 | $5,425 | $1,013,000 | $379,020 | $633,980 |
| 2022 | $4,987 | $522,500 | $206,655 | $315,845 |
| 2021 | $4,490 | $705,000 | $250,011 | $454,989 |
| 2020 | $4,284 | $655,000 | $214,475 | $440,525 |
| 2019 | $4,129 | $620,000 | $211,596 | $408,404 |
| 2018 | $3,828 | $573,000 | $180,183 | $392,817 |
| 2016 | $3,667 | $288,530 | $84,598 | $203,932 |
| 2015 | $3,713 | $277,420 | $84,598 | $192,822 |
| 2014 | $3,731 | $283,753 | $66,921 | $216,832 |
| 2013 | -- | $255,434 | $58,975 | $196,459 |
Source: Public Records
Map
Nearby Homes
- Butler Traditional Plan at Crested Peaks
- 461 W Summit Ln
- 1248 S Kentucky Derby Way
- 879 W Saddlebrook Dr
- 874 W Steeple Chase Dr
- Timpani Plan at Sunset Equestrian
- Octave Plan at Sunset Equestrian
- Madrigal Plan at Sunset Equestrian
- Harvard Plan at Sunset Equestrian
- Fortissimo Plan at Sunset Equestrian
- Canon Plan at Sunset Equestrian
- Finale Plan at Sunset Equestrian
- Forte Plan at Sunset Equestrian
- Bravo Plan at Sunset Equestrian
- Accord Plan at Sunset Equestrian
- Ballad Plan at Sunset Equestrian
- Adagio Plan at Sunset Equestrian
- Anthem Plan at Sunset Equestrian
- 382 W Parkway Dr
- 1310 S 125 E
- 1264 Derby Ct
- 1276 Derby Ct
- 1252 Derby Ct
- 1271 Morgan Bay Ct
- 1283 Morgan Bay Ct
- 1267 Derby Ct
- 1240 Derby Ct
- 1279 Derby Ct
- 1288 Derby Ct
- 1255 Derby Ct
- 1255 Derby Ct Unit 205
- 533 Western Dr
- 1295 Morgan Bay Ct
- 1259 Morgan Bay Ct
- 1291 Derby Ct
- 1259 Morgan Bay Ct
- 1259 Morgan Bay Ct Unit 504
- 657 Brinley Ct Unit 5
- 657 Brinley Ct Unit 5
- 635 Brinley Ct