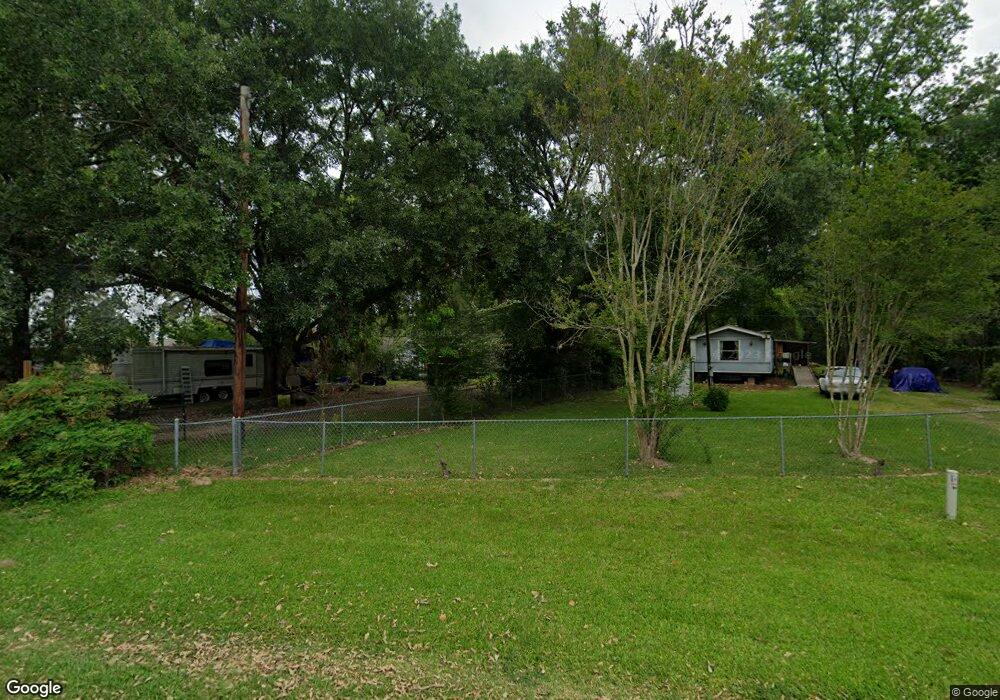
12648 Zion Rd Tomball, TX 77375
Hufsmith NeighborhoodEstimated Value: $238,767 - $629,000
2
Beds
1
Bath
1,135
Sq Ft
$331/Sq Ft
Est. Value
About This Home
This home is located at 12648 Zion Rd, Tomball, TX 77375 and is currently estimated at $375,942, approximately $331 per square foot. 12648 Zion Rd is a home located in Harris County with nearby schools including Tomball Elementary School, Tomball Intermediate School, and Tomball Junior High School.
Ownership History
Date
Name
Owned For
Owner Type
Purchase Details
Closed on
Jul 21, 2017
Sold by
Russell Jesse and Russell Katie
Bought by
Shuck Matthew C
Current Estimated Value
Home Financials for this Owner
Home Financials are based on the most recent Mortgage that was taken out on this home.
Original Mortgage
$152,000
Outstanding Balance
$126,286
Interest Rate
3.89%
Mortgage Type
New Conventional
Estimated Equity
$249,656
Purchase Details
Closed on
Aug 9, 2016
Sold by
Cox Ernest F and Barbra N Cox S
Bought by
Russell Jesse and Russell Kathie
Home Financials for this Owner
Home Financials are based on the most recent Mortgage that was taken out on this home.
Original Mortgage
$58,000
Interest Rate
3.45%
Mortgage Type
New Conventional
Purchase Details
Closed on
Oct 21, 2004
Sold by
Gresham John M
Bought by
Cox Ernest F and Cox Barbara N
Create a Home Valuation Report for This Property
The Home Valuation Report is an in-depth analysis detailing your home's value as well as a comparison with similar homes in the area
Home Values in the Area
Average Home Value in this Area
Purchase History
| Date | Buyer | Sale Price | Title Company |
|---|---|---|---|
| Shuck Matthew C | -- | Stewart Title | |
| Russell Jesse | -- | Stewart Title | |
| Cox Ernest F | -- | -- |
Source: Public Records
Mortgage History
| Date | Status | Borrower | Loan Amount |
|---|---|---|---|
| Open | Shuck Matthew C | $152,000 | |
| Previous Owner | Russell Jesse | $58,000 |
Source: Public Records
Tax History Compared to Growth
Tax History
| Year | Tax Paid | Tax Assessment Tax Assessment Total Assessment is a certain percentage of the fair market value that is determined by local assessors to be the total taxable value of land and additions on the property. | Land | Improvement |
|---|---|---|---|---|
| 2025 | $1,822 | $226,498 | $28,750 | $197,748 |
| 2024 | $1,822 | $210,945 | $28,750 | $182,195 |
| 2023 | $1,822 | $230,725 | $28,750 | $201,975 |
| 2022 | $2,691 | $170,438 | $28,750 | $141,688 |
| 2021 | $2,533 | $121,381 | $28,750 | $92,631 |
| 2020 | $2,591 | $120,147 | $28,750 | $91,397 |
| 2019 | $3,218 | $0 | $0 | $0 |
| 2018 | $1,935 | $144,431 | $28,750 | $115,681 |
| 2017 | $3,214 | $144,431 | $28,750 | $115,681 |
| 2016 | $1,228 | $55,199 | $20,125 | $35,074 |
| 2015 | $125 | $55,199 | $20,125 | $35,074 |
| 2014 | $125 | $53,987 | $20,125 | $33,862 |
Source: Public Records
Map
Nearby Homes
- 12614 Fort Isabella Dr
- 12510 Sherborne Castle Ct
- 12122 Zion Rd
- 31106 Gullwing Manor Dr
- 31211 Raleigh Creek Dr
- 31134 Gullwing Manor Dr
- 31218 Gullwing Manor Dr
- 12806 Durham Creek Ln
- 25010 Butler Hill Ct
- 13303 Lost Creek Rd
- 25003 Tarlton Ct
- 1323 E Hufsmith Rd
- 24801 Stanolind Rd
- 12118 S Tara Plantation Dr
- 24102 Flax Ct
- 31414 Helen Ln
- 803 Junction Point Ln
- 25142 W Tara Plantation Dr
- 25202 Wilkes Park Rd
- 11827 Tara Plantation Dr
- 12630 Zion Rd
- 12640 Zion Rd
- 12702 Zion Rd
- 30807 Raleigh Creek Dr
- 30811 Raleigh Creek Dr
- 30803 Raleigh Creek Dr
- 30831 Raleigh Creek Dr
- 30803 Raleigh Creek Dr
- 30815 Raleigh Creek Dr
- 30819 Berkshire Downs Dr
- 30815 Berkshire Downs Dr
- 30823 Berkshire Downs Dr
- 12638 Zion Rd
- 30819 Raleigh Creek Dr
- 30731 Raleigh Creek Dr
- 30811 Berkshire Downs Dr
- 30827 Berkshire Downs Dr
- 30731 Raleigh Creek Dr
- 30807 Raleigh Creek
- 30811 Raleigh Creek