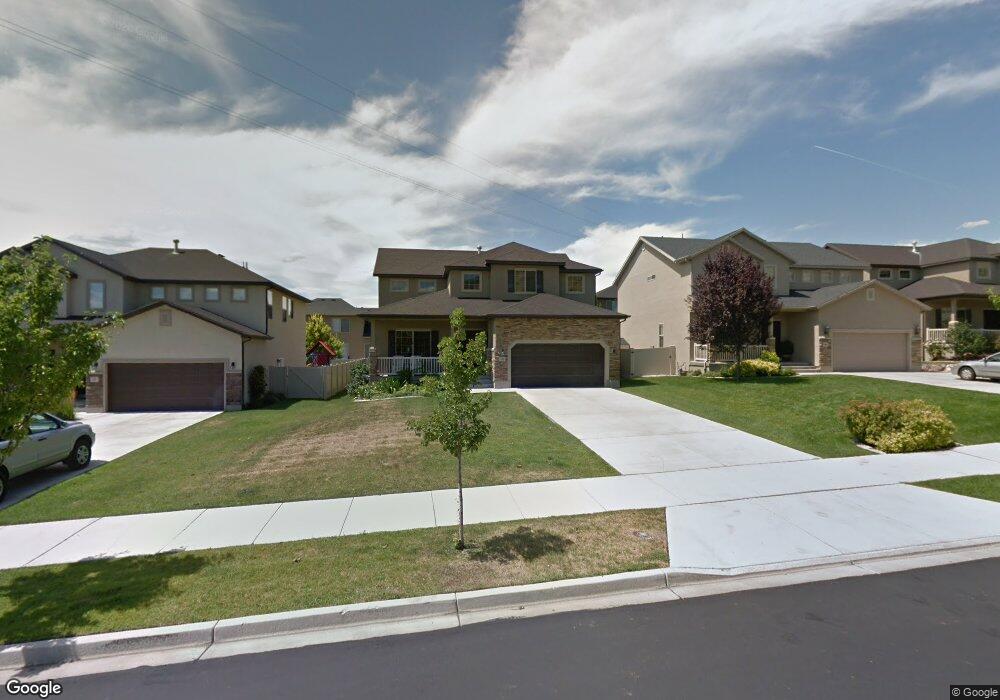
1265 Cinnamon Ridge Cir Provo, UT 84606
Provost NeighborhoodEstimated Value: $669,000 - $706,000
5
Beds
4
Baths
3,608
Sq Ft
$191/Sq Ft
Est. Value
About This Home
This home is located at 1265 Cinnamon Ridge Cir, Provo, UT 84606 and is currently estimated at $689,107, approximately $190 per square foot. 1265 Cinnamon Ridge Cir is a home located in Utah County with nearby schools including Provost School, Centennial Middle School, and Timpview High School.
Ownership History
Date
Name
Owned For
Owner Type
Purchase Details
Closed on
Jul 14, 2021
Sold by
Choi Chang Woog
Bought by
Hu Min and Pang Chao
Current Estimated Value
Home Financials for this Owner
Home Financials are based on the most recent Mortgage that was taken out on this home.
Original Mortgage
$170,000
Outstanding Balance
$156,423
Interest Rate
3.87%
Mortgage Type
New Conventional
Estimated Equity
$532,684
Purchase Details
Closed on
May 9, 2012
Sold by
Kim Hyeon Mi
Bought by
Choi Chang Woog
Purchase Details
Closed on
Nov 28, 2007
Sold by
Camberlango Development Group Llc
Bought by
Kim Hyeon Mi
Home Financials for this Owner
Home Financials are based on the most recent Mortgage that was taken out on this home.
Original Mortgage
$307,732
Interest Rate
6.36%
Mortgage Type
Purchase Money Mortgage
Purchase Details
Closed on
Nov 4, 2005
Sold by
Salibury Development Lc
Bought by
Red Cedar Properties Lc
Create a Home Valuation Report for This Property
The Home Valuation Report is an in-depth analysis detailing your home's value as well as a comparison with similar homes in the area
Home Values in the Area
Average Home Value in this Area
Purchase History
| Date | Buyer | Sale Price | Title Company |
|---|---|---|---|
| Hu Min | -- | United West Title | |
| Choi Chang Woog | -- | Eagle Gate Title Ins Agency | |
| Kim Hyeon Mi | -- | Provo Land Title Company | |
| Red Cedar Properties Lc | -- | Provo Land Title Company |
Source: Public Records
Mortgage History
| Date | Status | Borrower | Loan Amount |
|---|---|---|---|
| Open | Hu Min | $170,000 | |
| Previous Owner | Kim Hyeon Mi | $307,732 |
Source: Public Records
Tax History
| Year | Tax Paid | Tax Assessment Tax Assessment Total Assessment is a certain percentage of the fair market value that is determined by local assessors to be the total taxable value of land and additions on the property. | Land | Improvement |
|---|---|---|---|---|
| 2025 | $3,156 | $327,800 | -- | -- |
| 2024 | $3,156 | $310,640 | $0 | $0 |
| 2023 | $3,207 | $311,245 | $0 | $0 |
| 2022 | $3,083 | $301,620 | $0 | $0 |
| 2021 | $2,462 | $420,100 | $114,500 | $305,600 |
| 2020 | $2,372 | $379,400 | $104,100 | $275,300 |
| 2019 | $2,280 | $379,400 | $104,100 | $275,300 |
| 2018 | $2,162 | $364,800 | $100,800 | $264,000 |
| 2017 | $1,959 | $181,610 | $0 | $0 |
| 2016 | $1,975 | $170,720 | $0 | $0 |
| 2015 | $1,827 | $159,610 | $0 | $0 |
| 2014 | $1,418 | $129,140 | $0 | $0 |
Source: Public Records
Map
Nearby Homes
- 1332 Cinnamon Ridge Way
- 1304 E 900 S
- 1154 S 1430 E
- 1417 E 700 S
- 1169 E 700 S
- 1482 E 1280 S
- 1141 E 1320 S Unit A404
- 1141 E 1320 S Unit B401
- 1141 E 1320 S Unit D104
- 1141 E 1320 S Unit D303
- 1141 E 1320 S Unit 302
- 1156 S 1000 E
- 1184 S 1000 E
- 1347 S 1370 E
- 984 E 900 S
- 1052 Canyon Meadow Dr Unit 4
- 1263 S 1000 E
- 1245 E 580 S
- 1077 Canyon Meadow Dr Unit 3
- 596 S 1500 E
- 1257 Cinnamon Ridge Cir
- 1283 Cinnamon Ridge Cir
- 1283 Cinnamon Ridge Cir Unit LOT 3
- 1283 Cinnamon Ridge Cir Unit 3
- 1301 Cinnamon Ridge Cir
- 1278 Cinnamon Ridge Way
- 1278 Cinnamon Ridge Way Unit 41
- 1249 Cinnamon Ridge Cir
- 1278 Cinnamon Ridge Way Unit LOT 41
- 1262 Cinnamon Ridge Way
- 1262 Cinnamon Ridge Way Unit 40
- 1294 Cinnamon Ridge Way
- 1254 S Cinnamon Ridge E Unit 39
- 1254 Cinnamon Ridge Way
- 979 Cinnamon Ridge Ln Unit 39
- 1325 Cinnamon Ridge Cir
- 1274 Cinnamon Ridge Cir
- 1314 E Cinnamon Ridge S Unit LOT 43
- 1314 Cinnamon Ridge Way
- 1296 Cinnamon Ridge Cir
Your Personal Tour Guide
Ask me questions while you tour the home.