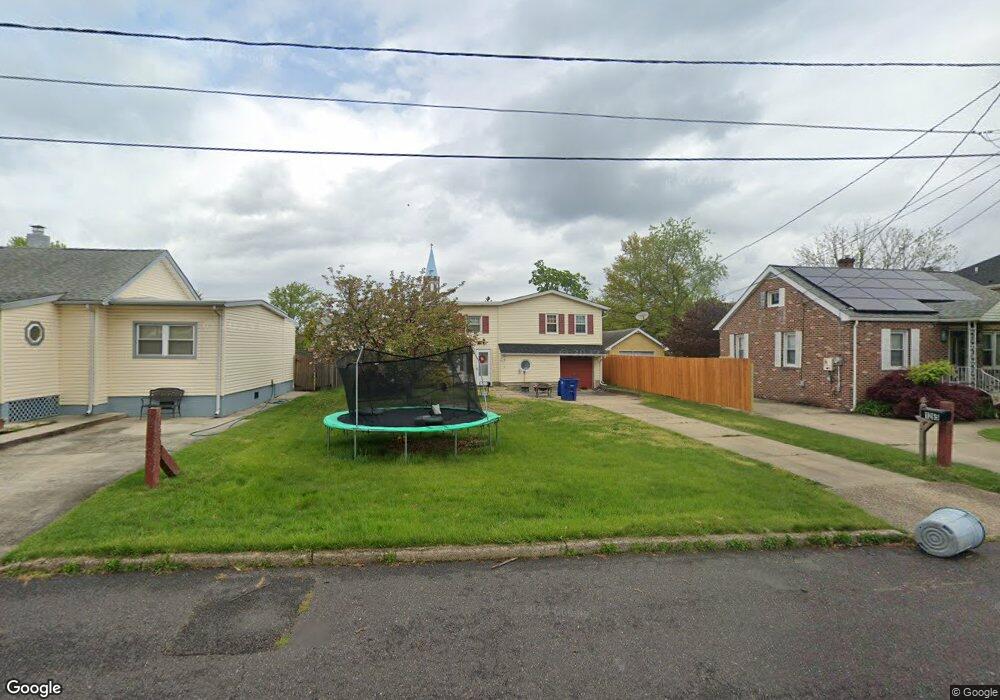
1265 Highview Ave Roebling, NJ 08554
Estimated Value: $314,085 - $412,000
Studio
--
Bath
1,717
Sq Ft
$212/Sq Ft
Est. Value
About This Home
This home is located at 1265 Highview Ave, Roebling, NJ 08554 and is currently estimated at $363,271, approximately $211 per square foot. 1265 Highview Ave is a home located in Burlington County with nearby schools including Number 5, Roebling Elementary School, Riverfront Middle School, and Florence Twp Mem High School.
Ownership History
Date
Name
Owned For
Owner Type
Purchase Details
Closed on
Apr 29, 2020
Sold by
Queens Park Oval Asset Holding Trust
Bought by
Us Bank Trust Na and Kingsmead Asset Holding Trust
Current Estimated Value
Purchase Details
Closed on
Feb 27, 2017
Sold by
Gates Dawn M and Gates Scott L
Bought by
Queens Park Oval Asset Holding Tust
Purchase Details
Closed on
Oct 29, 1999
Sold by
Gerboc David and Gerboc Tracy
Bought by
Gates Scott L and Gates Dawn M
Home Financials for this Owner
Home Financials are based on the most recent Mortgage that was taken out on this home.
Original Mortgage
$108,998
Interest Rate
7.73%
Mortgage Type
FHA
Purchase Details
Closed on
Sep 29, 1995
Sold by
Santoleri Eileen
Bought by
Gerboc David and Gerboc Tracy
Purchase Details
Closed on
Nov 14, 1994
Sold by
Santoleri William R and Santoleri Eileen
Bought by
Santoleri Eileen
Create a Home Valuation Report for This Property
The Home Valuation Report is an in-depth analysis detailing your home's value as well as a comparison with similar homes in the area
Home Values in the Area
Average Home Value in this Area
Purchase History
| Date | Buyer | Sale Price | Title Company |
|---|---|---|---|
| Us Bank Trust Na | -- | None Available | |
| Queens Park Oval Asset Holding Tust | -- | Terra Abstract Inc | |
| Gates Scott L | $109,900 | Credit Lenders Title Agency | |
| Gerboc David | $96,000 | -- | |
| Santoleri Eileen | -- | -- |
Source: Public Records
Mortgage History
| Date | Status | Borrower | Loan Amount |
|---|---|---|---|
| Previous Owner | Gates Scott L | $108,998 |
Source: Public Records
Tax History
| Year | Tax Paid | Tax Assessment Tax Assessment Total Assessment is a certain percentage of the fair market value that is determined by local assessors to be the total taxable value of land and additions on the property. | Land | Improvement |
|---|---|---|---|---|
| 2025 | $6,354 | $228,000 | $74,100 | $153,900 |
| 2024 | $6,083 | $228,000 | $74,100 | $153,900 |
| 2023 | $6,083 | $228,000 | $74,100 | $153,900 |
| 2022 | $5,953 | $228,000 | $74,100 | $153,900 |
| 2021 | $5,901 | $228,000 | $74,100 | $153,900 |
| 2020 | $5,226 | $202,700 | $74,100 | $128,600 |
| 2019 | $5,179 | $202,700 | $74,100 | $128,600 |
| 2018 | $5,134 | $202,700 | $74,100 | $128,600 |
| 2017 | $5,072 | $202,700 | $74,100 | $128,600 |
| 2016 | $4,974 | $202,700 | $74,100 | $128,600 |
| 2015 | $4,873 | $202,700 | $74,100 | $128,600 |
| 2014 | $4,737 | $202,700 | $74,100 | $128,600 |
Source: Public Records
Map
Nearby Homes
- 1273 Highview Ave
- 1245 Highview Ave
- 1274 Emerick Ave
- 1250 Emerick Ave
- 1277 Highview Ave
- 1243 Highview Ave
- 1240 Emerick Ave
- 1270 Emerick Ave
- 1230 Emerick Ave
- 1260 Highview Ave
- 1250 Highview Ave
- 100 Parrish Ln
- 1241 Highview Ave
- 1295 Highview Ave
- 1220 Emerick Ave
- 1230 Highview Ave
- 301 Parrish Ln
- 0 Emerick Ave
- LOT3.02 Emerick Ave
- 300 Station Rd
Your Personal Tour Guide
Ask me questions while you tour the home.