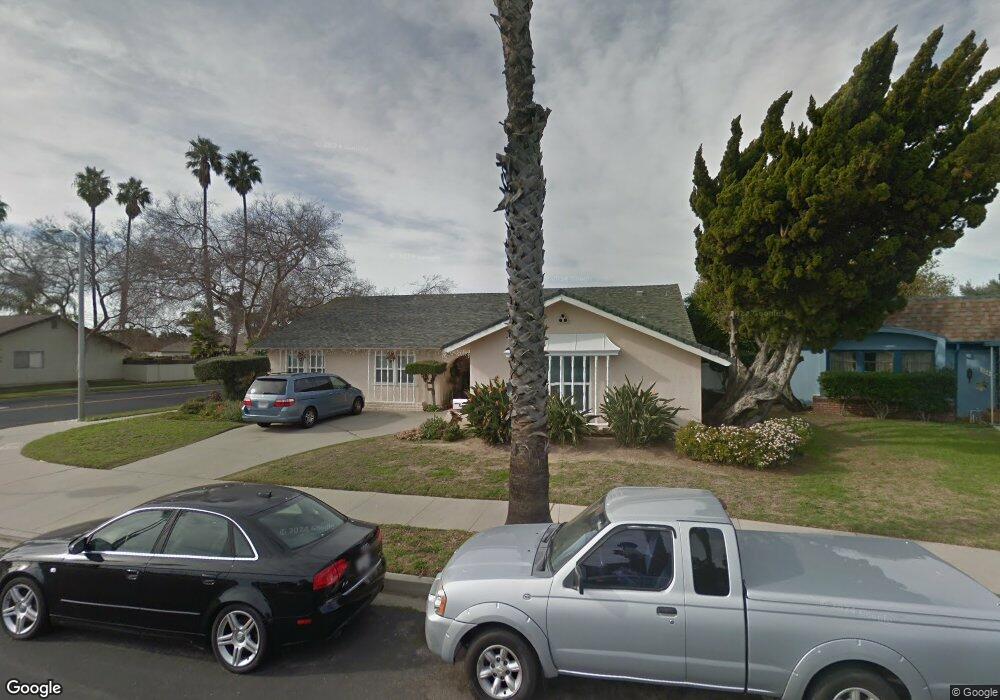
1265 S Ventura Rd Oxnard, CA 93033
Marina West NeighborhoodEstimated Value: $698,000 - $886,063
4
Beds
3
Baths
2,297
Sq Ft
$347/Sq Ft
Est. Value
About This Home
This home is located at 1265 S Ventura Rd, Oxnard, CA 93033 and is currently estimated at $798,016, approximately $347 per square foot. 1265 S Ventura Rd is a home located in Ventura County with nearby schools including Marina West Elementary School, Oxnard High School, and New Harvest Christian School.
Ownership History
Date
Name
Owned For
Owner Type
Purchase Details
Closed on
Nov 10, 2006
Sold by
Lacambacal Exequiel A and Lacambacal Susan E
Bought by
Lacambacal Exequiel A and Lacambacal Susan E
Current Estimated Value
Home Financials for this Owner
Home Financials are based on the most recent Mortgage that was taken out on this home.
Original Mortgage
$427,000
Interest Rate
6.37%
Mortgage Type
Stand Alone First
Create a Home Valuation Report for This Property
The Home Valuation Report is an in-depth analysis detailing your home's value as well as a comparison with similar homes in the area
Home Values in the Area
Average Home Value in this Area
Purchase History
We collect this data history from publicly available records. To have your information removed, we recommend requesting removal directly through your county’s website.
| Date | Buyer | Sale Price | Title Company |
|---|---|---|---|
| Lacambacal Exequiel A | -- | First American Title Company |
Source: Public Records
Mortgage History
We collect this data history from publicly available records. To have your information removed, we recommend requesting removal directly through your county’s website.
| Date | Status | Borrower | Loan Amount |
|---|---|---|---|
| Closed | Lacambacal Exequiel A | $427,000 | |
| Closed | Lacambacal Exequiel A | $50,000 |
Source: Public Records
Tax History
| Year | Tax Paid | Tax Assessment Tax Assessment Total Assessment is a certain percentage of the fair market value that is determined by local assessors to be the total taxable value of land and additions on the property. | Land | Improvement |
|---|---|---|---|---|
| 2025 | $4,232 | $353,440 | $121,450 | $231,990 |
| 2024 | $4,232 | $346,510 | $119,068 | $227,442 |
| 2023 | $4,077 | $339,716 | $116,733 | $222,983 |
| 2022 | $3,953 | $333,055 | $114,444 | $218,611 |
| 2021 | $3,920 | $326,525 | $112,200 | $214,325 |
| 2020 | $3,992 | $323,178 | $111,050 | $212,128 |
| 2019 | $3,878 | $316,842 | $108,873 | $207,969 |
| 2018 | $3,823 | $310,631 | $106,739 | $203,892 |
| 2017 | $3,628 | $304,542 | $104,647 | $199,895 |
| 2016 | $3,500 | $298,572 | $102,596 | $195,976 |
| 2015 | $3,535 | $294,089 | $101,056 | $193,033 |
| 2014 | $3,495 | $288,329 | $99,077 | $189,252 |
Source: Public Records
Map
Nearby Homes
- 1501 Pisco Ln
- 1621 Pisco Ln
- 1214 S Ventura Rd
- 1310 Hill St
- 1431 Rialto St
- 1120 Pisco Ln
- 1130 Bogota Ct
- 257 E Garden Green
- 137 E Garden Green
- 269 E Elfin Green
- 13 W Garden Green
- 306 E Elfin Green
- 11 W Fiesta Green
- 1231 Lost Point Ln
- 20 W Fiesta Green
- 1720 Elsinore Cir
- 75 W Fiesta Green
- 1431 Casa San Carlos Ln Unit B
- 1331 Casa San Carlos Ln Unit C
- 676 Snipe Walk
Your Personal Tour Guide
Ask me questions while you tour the home.