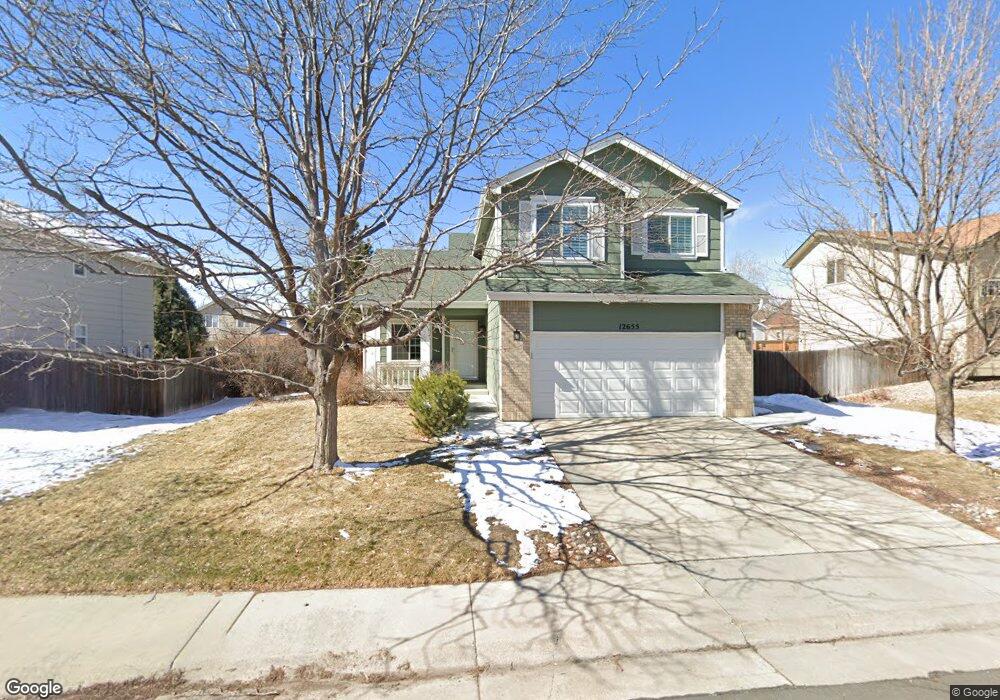
12655 Xavier St Broomfield, CO 80020
Willow Park NeighborhoodEstimated Value: $640,933 - $740,000
4
Beds
3
Baths
2,459
Sq Ft
$276/Sq Ft
Est. Value
About This Home
This home is located at 12655 Xavier St, Broomfield, CO 80020 and is currently estimated at $678,733, approximately $276 per square foot. 12655 Xavier St is a home located in Broomfield County with nearby schools including Mountain View Elementary School, Westlake Middle School, and Legacy High School.
Ownership History
Date
Name
Owned For
Owner Type
Purchase Details
Closed on
Feb 19, 2013
Sold by
Kessel Joseph Keith and Sarkiala Kessel Eva M
Bought by
Baker Gregory R and Baker Emma L
Current Estimated Value
Home Financials for this Owner
Home Financials are based on the most recent Mortgage that was taken out on this home.
Original Mortgage
$270,146
Outstanding Balance
$189,631
Interest Rate
3.5%
Mortgage Type
FHA
Estimated Equity
$489,102
Purchase Details
Closed on
Jan 31, 2000
Sold by
Nguyen Thuy T
Bought by
Kessel Joseph Keith And
Purchase Details
Closed on
Sep 5, 1997
Sold by
Richmond American Homes
Bought by
Nguyen Thuy T
Purchase Details
Closed on
Nov 25, 1996
Sold by
Tahc Number Fourteen Inc
Bought by
Richmond American Homes
Purchase Details
Closed on
May 11, 1995
Purchase Details
Closed on
May 14, 1993
Purchase Details
Closed on
Mar 4, 1993
Create a Home Valuation Report for This Property
The Home Valuation Report is an in-depth analysis detailing your home's value as well as a comparison with similar homes in the area
Home Values in the Area
Average Home Value in this Area
Purchase History
| Date | Buyer | Sale Price | Title Company |
|---|---|---|---|
| Baker Gregory R | $295,000 | First American | |
| Kessel Joseph Keith And | $220,000 | -- | |
| Nguyen Thuy T | $175,100 | -- | |
| Richmond American Homes | $675,000 | -- | |
| -- | $975,000 | -- | |
| -- | -- | -- | |
| -- | -- | -- |
Source: Public Records
Mortgage History
| Date | Status | Borrower | Loan Amount |
|---|---|---|---|
| Open | Baker Gregory R | $270,146 |
Source: Public Records
Tax History Compared to Growth
Tax History
| Year | Tax Paid | Tax Assessment Tax Assessment Total Assessment is a certain percentage of the fair market value that is determined by local assessors to be the total taxable value of land and additions on the property. | Land | Improvement |
|---|---|---|---|---|
| 2025 | $4,222 | $41,110 | $10,720 | $30,390 |
| 2024 | $4,222 | $39,370 | $9,800 | $29,570 |
| 2023 | $4,183 | $44,660 | $11,120 | $33,540 |
| 2022 | $3,562 | $31,530 | $7,990 | $23,540 |
| 2021 | $3,673 | $32,440 | $8,220 | $24,220 |
| 2020 | $3,497 | $30,550 | $7,510 | $23,040 |
| 2019 | $3,499 | $30,760 | $7,560 | $23,200 |
| 2018 | $3,231 | $27,400 | $5,830 | $21,570 |
| 2017 | $2,944 | $30,290 | $6,450 | $23,840 |
| 2016 | $2,711 | $24,590 | $5,930 | $18,660 |
| 2015 | $2,711 | $21,110 | $5,930 | $15,180 |
| 2014 | $2,391 | $21,110 | $5,930 | $15,180 |
Source: Public Records
Map
Nearby Homes
- 12620 Winona Ct
- 12695 Wolff St
- 5005 W 128th Place
- 12545 Tammywood St
- 5143 Yates Place
- 12450 Forest View St
- 1320 Stonehaven Ave
- 961 Birch St
- 3974 Cambridge Ave
- 3981 W 127th Ave
- 927 E 7th Ave
- 951 E 10th Ave
- 12205 Perry St Unit 56
- 12205 Perry St Unit 17
- 12205 Perry St Unit 259
- 12205 Perry St Unit 167
- 12205 Perry St Unit 67
- 12205 Perry St Unit 287
- 12510 Newton St
- 12217 Crabapple St
- 12645 Xavier St
- 12665 Xavier St
- 12660 Yates St
- 12650 Yates St
- 12670 Yates St
- 12635 Xavier St
- 12675 Xavier St
- 12660 Xavier St
- 12670 Xavier St
- 12650 Xavier St
- 12680 Yates St
- 12640 Yates St
- 12625 Xavier St
- 12680 Xavier St
- 12640 Xavier St
- 12690 Yates St
- 12655 Yates St
- 12615 Xavier St
- 12630 Xavier St
- 12690 Xavier St