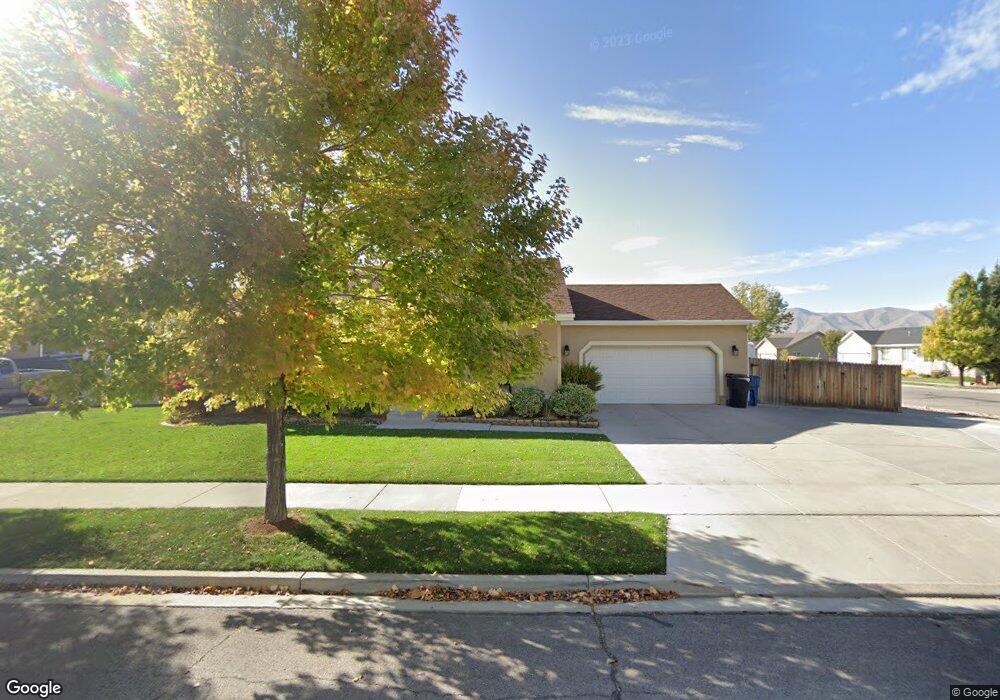
1266 S 360 W Payson, UT 84651
Estimated Value: $432,651 - $459,000
2
Beds
1
Bath
980
Sq Ft
$449/Sq Ft
Est. Value
About This Home
This home is located at 1266 S 360 W, Payson, UT 84651 and is currently estimated at $440,163, approximately $449 per square foot. 1266 S 360 W is a home located in Utah County with nearby schools including Spring Lake Elementary, Payson Junior High School, and Payson High School.
Ownership History
Date
Name
Owned For
Owner Type
Purchase Details
Closed on
Jun 15, 2001
Sold by
Av Pinn Llc
Bought by
Jewett Broc S and Jewett Camille
Current Estimated Value
Home Financials for this Owner
Home Financials are based on the most recent Mortgage that was taken out on this home.
Original Mortgage
$127,302
Outstanding Balance
$48,492
Interest Rate
7.14%
Mortgage Type
FHA
Estimated Equity
$391,671
Purchase Details
Closed on
Mar 2, 2001
Sold by
Hearthstone Development Inc
Bought by
Av Pinn Llc
Create a Home Valuation Report for This Property
The Home Valuation Report is an in-depth analysis detailing your home's value as well as a comparison with similar homes in the area
Home Values in the Area
Average Home Value in this Area
Purchase History
| Date | Buyer | Sale Price | Title Company |
|---|---|---|---|
| Jewett Broc S | -- | Fidelity Land & Title | |
| Av Pinn Llc | -- | Backman Stewart Title Servi |
Source: Public Records
Mortgage History
| Date | Status | Borrower | Loan Amount |
|---|---|---|---|
| Open | Jewett Broc S | $127,302 |
Source: Public Records
Tax History Compared to Growth
Tax History
| Year | Tax Paid | Tax Assessment Tax Assessment Total Assessment is a certain percentage of the fair market value that is determined by local assessors to be the total taxable value of land and additions on the property. | Land | Improvement |
|---|---|---|---|---|
| 2025 | $2,108 | $229,680 | $184,800 | $232,800 |
| 2024 | $2,108 | $214,555 | $0 | $0 |
| 2023 | $2,140 | $218,350 | $0 | $0 |
| 2022 | $2,123 | $213,070 | $0 | $0 |
| 2021 | $1,785 | $287,400 | $121,300 | $166,100 |
| 2020 | $1,688 | $265,800 | $110,300 | $155,500 |
| 2019 | $1,489 | $240,500 | $91,300 | $149,200 |
| 2018 | $1,346 | $209,500 | $79,800 | $129,700 |
| 2017 | $1,283 | $107,415 | $0 | $0 |
| 2016 | $1,214 | $100,925 | $0 | $0 |
| 2015 | $1,136 | $93,775 | $0 | $0 |
| 2014 | $1,004 | $83,545 | $0 | $0 |
Source: Public Records
Map
Nearby Homes
- 1398 S 400 St W
- 1161 Utah 198
- 1408 S 30 E
- 588 W 1450 S
- 1872 100 E Unit 6
- 1163 S 730 W
- 1567 Spur Ct
- 598 W Saddlebrook Dr
- 802 Brookside Ct
- 32 E 1690 S
- 32 E 1690 S Unit 113
- 1172 S 880 W
- 44 W 1690 S Unit 109
- 1449 S 910 W
- 336 E 1330 S
- 288 E 950 S
- 1582 S 790 W
- 1331 500 E Unit 120
- 1592 S 790 W
- 1567 S 910 W