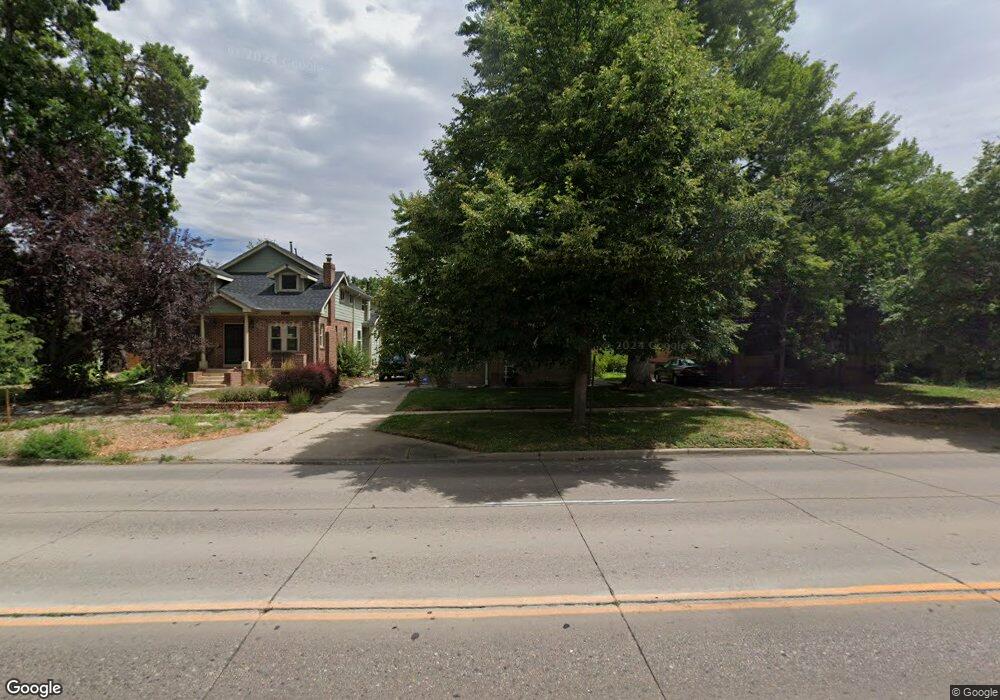
1266 S University Blvd Denver, CO 80210
Cory-Merrill NeighborhoodEstimated Value: $835,000 - $1,084,000
3
Beds
3
Baths
1,535
Sq Ft
$608/Sq Ft
Est. Value
About This Home
This home is located at 1266 S University Blvd, Denver, CO 80210 and is currently estimated at $932,928, approximately $607 per square foot. 1266 S University Blvd is a home located in Denver County with nearby schools including Cory Elementary School, Merrill Middle School, and South High School.
Ownership History
Date
Name
Owned For
Owner Type
Purchase Details
Closed on
Mar 8, 2008
Sold by
Favero Margaret and Favero Luigi C
Bought by
Favero Margaret M
Current Estimated Value
Purchase Details
Closed on
Jun 27, 2006
Sold by
Mary E Lamberton Trust
Bought by
Favero Margaret
Home Financials for this Owner
Home Financials are based on the most recent Mortgage that was taken out on this home.
Original Mortgage
$240,000
Outstanding Balance
$142,640
Interest Rate
6.67%
Mortgage Type
Unknown
Estimated Equity
$790,289
Purchase Details
Closed on
Jul 5, 2000
Sold by
Lamberton Mary E
Bought by
Mary E Lamberton Trust
Create a Home Valuation Report for This Property
The Home Valuation Report is an in-depth analysis detailing your home's value as well as a comparison with similar homes in the area
Home Values in the Area
Average Home Value in this Area
Purchase History
| Date | Buyer | Sale Price | Title Company |
|---|---|---|---|
| Favero Margaret M | -- | None Available | |
| Favero Margaret | $300,000 | Land Title Guarantee Company | |
| Mary E Lamberton Trust | -- | -- |
Source: Public Records
Mortgage History
| Date | Status | Borrower | Loan Amount |
|---|---|---|---|
| Open | Favero Margaret | $240,000 |
Source: Public Records
Tax History Compared to Growth
Tax History
| Year | Tax Paid | Tax Assessment Tax Assessment Total Assessment is a certain percentage of the fair market value that is determined by local assessors to be the total taxable value of land and additions on the property. | Land | Improvement |
|---|---|---|---|---|
| 2024 | $3,895 | $55,880 | $30,840 | $25,040 |
| 2023 | $3,811 | $55,880 | $30,840 | $25,040 |
| 2022 | $3,013 | $44,840 | $30,930 | $13,910 |
| 2021 | $2,909 | $46,130 | $31,820 | $14,310 |
| 2020 | $2,333 | $38,600 | $25,130 | $13,470 |
| 2019 | $2,268 | $38,600 | $25,130 | $13,470 |
| 2018 | $2,177 | $28,140 | $23,610 | $4,530 |
| 2017 | $2,171 | $28,140 | $23,610 | $4,530 |
| 2016 | $2,403 | $29,470 | $21,444 | $8,026 |
| 2015 | $2,302 | $29,470 | $21,444 | $8,026 |
| 2014 | $2,051 | $24,690 | $15,848 | $8,842 |
Source: Public Records
Map
Nearby Homes
- 1296 S York St
- 1352 S University Blvd
- 1280 S Gaylord St
- 1305 S Gaylord St
- 1208 S Elizabeth St
- 1250 S Vine St
- 1208 S Vine St
- 1366 S Vine St
- 1158 S Vine St
- 1410 S Elizabeth St
- 1476 S Josephine St
- 1100 S Elizabeth St
- 1414 S Vine St
- 1466 S Gaylord St
- 1035 S Josephine St
- 1491 S York St
- 1214 S Fillmore St
- 1520 S University Blvd
- 1021 S Columbine St
- 1518 S Columbine St
- 1260 S University Blvd
- 1272 S University Blvd
- 1250 S University Blvd
- 1282 S University Blvd
- 2351 E Louisiana Ave
- 1240 S University Blvd
- 1269 S Josephine St
- 1253 S Josephine St
- 1265 S Josephine St
- 1283 S Josephine St
- 1275 S University Blvd
- 1267 S University Blvd
- 1259 S University Blvd
- 1283 S University Blvd
- 1234 S University Blvd
- 1247 S Josephine St
- 1295 S Josephine St
- 1241 S Josephine St
- 1247 S University Blvd
- 1295 S University Blvd