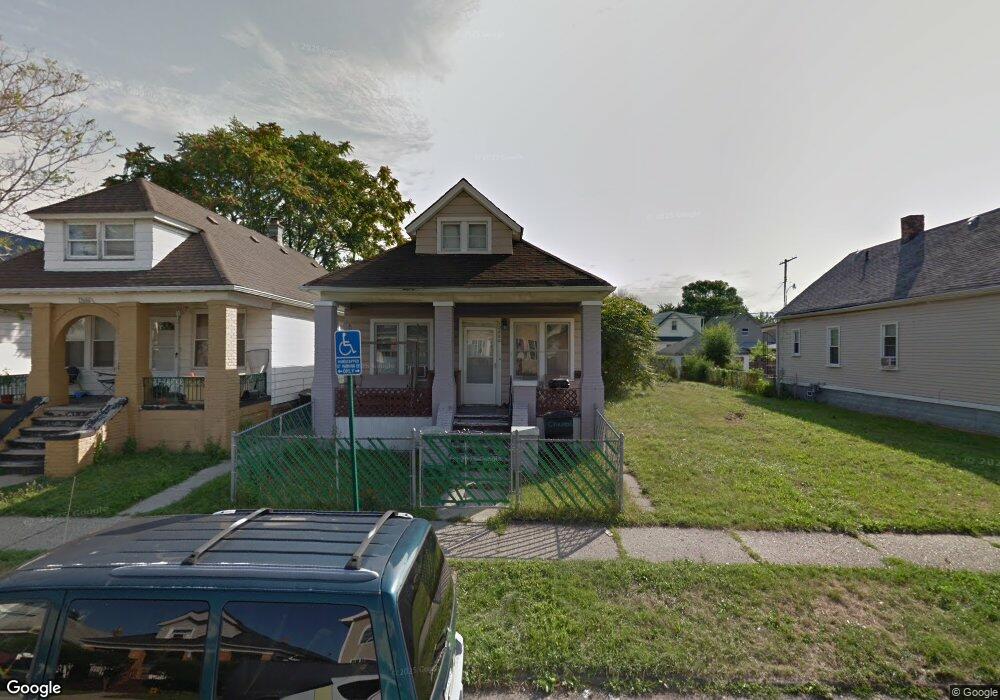
12666 Charest St HamtraMcK, MI 48212
Campau-Banglatown NeighborhoodEstimated Value: $70,000 - $156,000
Studio
1
Bath
748
Sq Ft
$159/Sq Ft
Est. Value
About This Home
This home is located at 12666 Charest St, HamtraMcK, MI 48212 and is currently estimated at $119,182, approximately $159 per square foot. 12666 Charest St is a home located in Wayne County with nearby schools including Davison Elementary-Middle School, Charles L. Spain Elementary-Middle School, and Edward 'Duke' Ellington Conservatory of Music and Art.
Ownership History
Date
Name
Owned For
Owner Type
Purchase Details
Closed on
May 24, 2017
Sold by
Morant Maya S
Bought by
Miah Mohammed Khaled
Current Estimated Value
Purchase Details
Closed on
Mar 30, 2017
Sold by
Morant Maya
Bought by
Morant Maya S
Purchase Details
Closed on
Jan 23, 2012
Sold by
United Community Housing Coalition
Bought by
Morant Steven N
Purchase Details
Closed on
Nov 22, 2011
Sold by
Wayne County Treasurer
Bought by
United Community Housing Coalition
Purchase Details
Closed on
Feb 5, 2008
Sold by
Ries Martin H
Bought by
Stockfisz Mara Lee
Purchase Details
Closed on
Jun 1, 2007
Sold by
Bonner Christopher J and Bonner Sara J
Bought by
Ries Martin H
Purchase Details
Closed on
Jun 4, 1993
Sold by
Pribish Alexander and Pribish Robert
Bought by
Bonner Christopher J
Create a Home Valuation Report for This Property
The Home Valuation Report is an in-depth analysis detailing your home's value as well as a comparison with similar homes in the area
Home Values in the Area
Average Home Value in this Area
Purchase History
| Date | Buyer | Sale Price | Title Company |
|---|---|---|---|
| Miah Mohammed Khaled | $25,000 | None Available | |
| Morant Maya S | -- | None Available | |
| Morant Steven N | -- | None Available | |
| United Community Housing Coalition | $600 | None Available | |
| Stockfisz Mara Lee | -- | None Available | |
| Ries Martin H | $40,000 | Multiple | |
| Bonner Christopher J | -- | Multiple | |
| Bonner Christopher J | $15,000 | Multiple |
Source: Public Records
Tax History
| Year | Tax Paid | Tax Assessment Tax Assessment Total Assessment is a certain percentage of the fair market value that is determined by local assessors to be the total taxable value of land and additions on the property. | Land | Improvement |
|---|---|---|---|---|
| 2025 | $827 | $22,500 | $0 | $0 |
| 2024 | $812 | $19,100 | $0 | $0 |
| 2023 | $787 | $12,900 | $0 | $0 |
| 2022 | $832 | $12,100 | $0 | $0 |
| 2021 | $812 | $9,400 | $0 | $0 |
| 2020 | $812 | $8,500 | $0 | $0 |
| 2019 | $802 | $6,900 | $0 | $0 |
| 2018 | $717 | $6,200 | $0 | $0 |
| 2017 | $116 | $6,100 | $0 | $0 |
| 2016 | $996 | $15,300 | $0 | $0 |
| 2015 | $1,000 | $10,000 | $0 | $0 |
| 2013 | $1,246 | $12,458 | $0 | $0 |
| 2010 | -- | $18,264 | $443 | $17,821 |
Source: Public Records
Map
Nearby Homes
- 12660 Gallagher St
- 3346 Meade St
- 12621 Moran St
- 12511 Gallagher St
- 13486 Gallagher St
- 12309 Klinger St
- 12140 Mitchell St
- 13402 Dean St
- 13826 Gallagher St
- 13479 Mackay St
- 12091 Sobieski St
- 12099 Klinger St
- 3875 Sobieski St
- 4994 Carpenter Ave
- 2438 Burnside St
- 13401 Justine St
- 2388 Neibel St
- 11730 Sobieski St
- 2393 Botsford St
- 2358 Neibel St
- 12660 Charest St
- 12670 Charest St
- 12658 Charest St
- 12678 Charest St
- 12646 Charest St
- 12684 Charest St
- 12663 Gallagher St
- 12671 Gallagher St
- 12642 Charest St
- 12690 Charest St
- 12653 Gallagher St
- 12679 Gallagher St
- 12683 Gallagher St
- 12665 Charest St
- 12636 Charest St
- 12661 Charest St
- 12671 Charest St
- 12694 Charest St
- 12655 Charest St
- 12677 Charest St
Your Personal Tour Guide
Ask me questions while you tour the home.