1267 Fisk Rd Compton, IL 61318
Estimated Value: $302,000 - $353,000
3
Beds
2
Baths
1,400
Sq Ft
$234/Sq Ft
Est. Value
About This Home
This home is located at 1267 Fisk Rd, Compton, IL 61318 and is currently estimated at $328,073, approximately $234 per square foot. 1267 Fisk Rd is a home located in Lee County with nearby schools including Paw Paw Elementary School.
Ownership History
Date
Name
Owned For
Owner Type
Purchase Details
Closed on
Apr 4, 2019
Sold by
Hensley Bryan L and Hensley Kevin J
Bought by
Hensley Bryan L and Hensley Kevin J
Current Estimated Value
Home Financials for this Owner
Home Financials are based on the most recent Mortgage that was taken out on this home.
Original Mortgage
$150,500
Outstanding Balance
$131,228
Interest Rate
4.3%
Mortgage Type
New Conventional
Estimated Equity
$196,845
Purchase Details
Closed on
Mar 25, 2011
Sold by
Clayton Michael and Clayton Karla
Bought by
Hensley Charles F
Home Financials for this Owner
Home Financials are based on the most recent Mortgage that was taken out on this home.
Original Mortgage
$168,000
Interest Rate
4.99%
Mortgage Type
New Conventional
Create a Home Valuation Report for This Property
The Home Valuation Report is an in-depth analysis detailing your home's value as well as a comparison with similar homes in the area
Purchase History
| Date | Buyer | Sale Price | Title Company |
|---|---|---|---|
| Hensley Bryan L | -- | Wheatland Title Guaranty | |
| Hensley Charles F | $210,000 | None Available |
Source: Public Records
Mortgage History
| Date | Status | Borrower | Loan Amount |
|---|---|---|---|
| Open | Hensley Bryan L | $150,500 | |
| Closed | Hensley Charles F | $168,000 |
Source: Public Records
Tax History
| Year | Tax Paid | Tax Assessment Tax Assessment Total Assessment is a certain percentage of the fair market value that is determined by local assessors to be the total taxable value of land and additions on the property. | Land | Improvement |
|---|---|---|---|---|
| 2024 | $7,063 | $97,187 | $28,012 | $69,175 |
| 2023 | $5,282 | $68,929 | $24,358 | $44,571 |
| 2022 | $4,141 | $52,803 | $15,755 | $37,048 |
| 2021 | $3,902 | $48,892 | $14,588 | $34,304 |
| 2020 | $3,827 | $47,468 | $14,163 | $33,305 |
| 2019 | $3,762 | $46,085 | $13,750 | $32,335 |
| 2018 | $3,988 | $48,010 | $14,420 | $33,590 |
| 2017 | $3,729 | $46,612 | $14,000 | $32,612 |
| 2016 | $3,731 | $46,612 | $14,000 | $32,612 |
| 2015 | $3,757 | $46,612 | $14,000 | $32,612 |
| 2014 | $3,775 | $47,631 | $17,508 | $30,123 |
| 2013 | $3,351 | $49,104 | $18,049 | $31,055 |
Source: Public Records
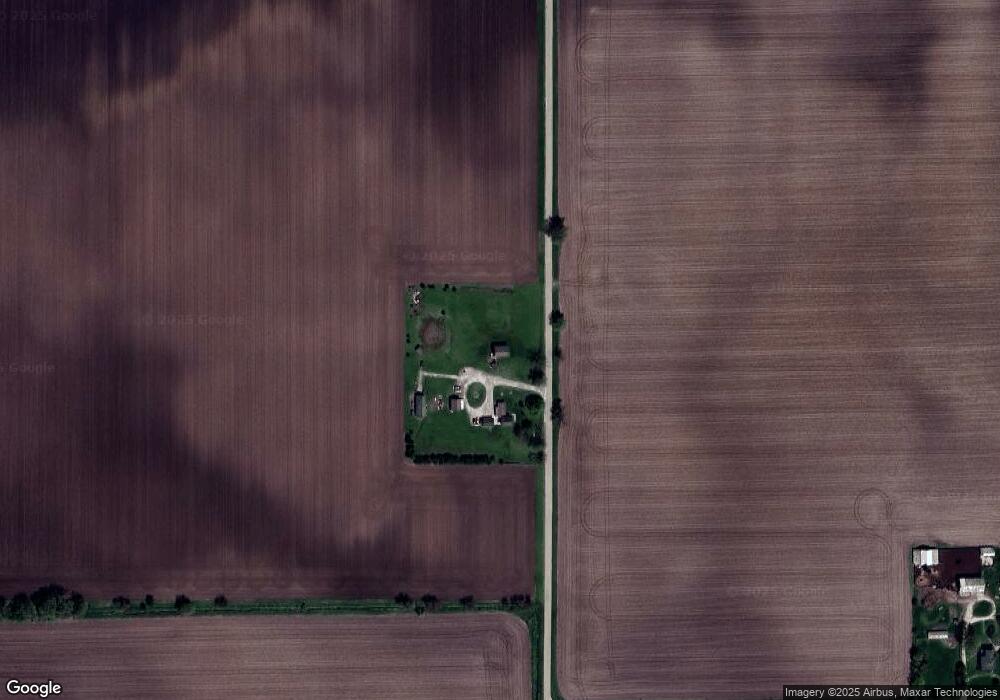
Map
Nearby Homes
- 1519 Il Route 251
- 00 Shaw Rd
- 0 Shaw Rd
- 000 Shaw Rd
- 1204 Illinois 251
- 2547 Reynolds Rd
- 3494 Howlett Rd
- 281 W Hardanger Gate
- 201 W Hardanger Gate
- 2532 Johnson St
- 359 Wyoming Ave
- 193 Chicago Rd
- Todd Rd and Houghtby Rd
- 2034 Gittleson Rd
- Paw Rd
- 1946 Woodlawn Rd
- 3379 Hayes Rd
- 909 Preserve Rd
- 216 Lake Lida Ln
- Lt 1 South 7th St
Your Personal Tour Guide
Ask me questions while you tour the home.