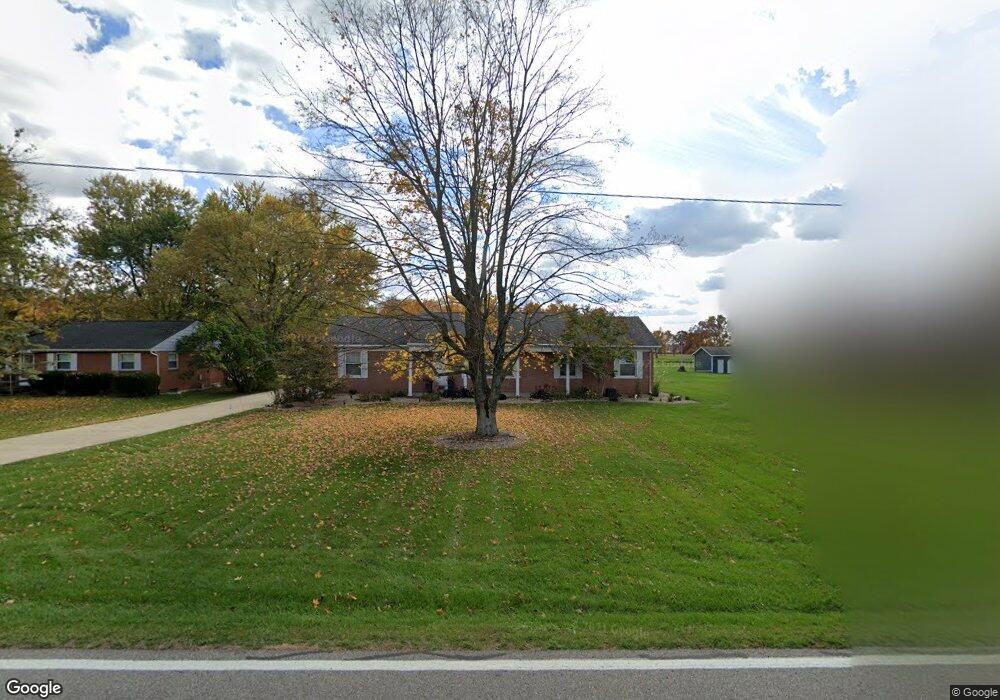
1267 Owens Rd W Marion, OH 43302
Estimated Value: $215,796 - $253,000
3
Beds
3
Baths
1,232
Sq Ft
$192/Sq Ft
Est. Value
About This Home
This home is located at 1267 Owens Rd W, Marion, OH 43302 and is currently estimated at $236,199, approximately $191 per square foot. 1267 Owens Rd W is a home located in Marion County with nearby schools including Pleasant Elementary School, Pleasant Middle School, and Pleasant High School.
Ownership History
Date
Name
Owned For
Owner Type
Purchase Details
Closed on
Apr 7, 2017
Sold by
Rovtar Brad V and Rovtar Bradley V
Bought by
Rovtar Kristine A
Current Estimated Value
Purchase Details
Closed on
Jul 17, 2006
Sold by
Rovtar Teresa
Bought by
Rovtar Bradley
Home Financials for this Owner
Home Financials are based on the most recent Mortgage that was taken out on this home.
Original Mortgage
$110,000
Interest Rate
6.66%
Mortgage Type
New Conventional
Purchase Details
Closed on
Jun 5, 2006
Sold by
Horn Obra D and Horn Wanda E
Bought by
Rovtar Brad
Home Financials for this Owner
Home Financials are based on the most recent Mortgage that was taken out on this home.
Original Mortgage
$110,000
Interest Rate
6.66%
Mortgage Type
New Conventional
Purchase Details
Closed on
Oct 20, 2005
Sold by
Dutton Leafie I
Bought by
Horn Obra D and Horn Wanda E
Purchase Details
Closed on
Feb 11, 2004
Bought by
Rovtar Brad
Purchase Details
Closed on
Mar 18, 1999
Bought by
Rovtar Brad
Create a Home Valuation Report for This Property
The Home Valuation Report is an in-depth analysis detailing your home's value as well as a comparison with similar homes in the area
Purchase History
| Date | Buyer | Sale Price | Title Company |
|---|---|---|---|
| Rovtar Kristine A | -- | Attorney | |
| Rovtar Bradley | -- | None Available | |
| Rovtar Brad | $137,500 | Eagle Title Llc | |
| Horn Obra D | $127,500 | Prime Equity Title | |
| Rovtar Brad | -- | -- | |
| Rovtar Brad | -- | -- |
Source: Public Records
Mortgage History
| Date | Status | Borrower | Loan Amount |
|---|---|---|---|
| Previous Owner | Rovtar Brad | $110,000 |
Source: Public Records
Tax History
| Year | Tax Paid | Tax Assessment Tax Assessment Total Assessment is a certain percentage of the fair market value that is determined by local assessors to be the total taxable value of land and additions on the property. | Land | Improvement |
|---|---|---|---|---|
| 2025 | $2,351 | $70,640 | $10,180 | $60,460 |
| 2024 | $2,351 | $58,100 | $9,860 | $48,240 |
| 2023 | $2,351 | $58,100 | $9,860 | $48,240 |
| 2022 | $2,350 | $58,100 | $9,860 | $48,240 |
| 2021 | $1,772 | $41,730 | $8,020 | $33,710 |
| 2020 | $1,748 | $41,730 | $8,020 | $33,710 |
| 2019 | $1,831 | $41,730 | $8,020 | $33,710 |
| 2018 | $1,309 | $39,720 | $7,020 | $32,700 |
| 2017 | $1,313 | $39,720 | $7,020 | $32,700 |
| 2016 | $1,308 | $39,720 | $7,020 | $32,700 |
| 2015 | $1,328 | $38,750 | $6,680 | $32,070 |
| 2014 | $1,331 | $38,750 | $6,680 | $32,070 |
| 2012 | $1,345 | $38,970 | $6,450 | $32,520 |
Source: Public Records
Map
Nearby Homes
- 3226 Cobblestone Creek Rd
- 3161 Smeltzer Rd
- 3200 Smeltzer Rd Unit 57
- 3200 Smeltzer Rd Unit 92
- 3200 Smeltzer Rd Unit Lot 10
- 3200 Smeltzer Rd Unit 53
- 3200 Smeltzer Rd Unit 22
- 1279 Somerlot Hoffman Rd W
- 1196 Somerlot Hoffman Rd W
- 3612 Pleasant Dr
- 2680 Marion Marysville Rd
- 2554 Marion Marysville Rd
- 1907 Karla Dr
- 1455 Marion Country Club Dr
- 1467 Marion Country Club Dr
- 1900 Somerlot Hoffman Rd W
- 1470 Marion Country Club Dr
- 1518 Marion Country Club Dr
- 1506 Marion Country Club Dr
- 1530 Marion Country Club Dr
- 1279 Owens Rd W
- 1255 Owens Rd W
- 1249 Owens Rd W
- 1233 Owens Rd W
- 1242 Owens Rd W
- 1223 Owens Rd W
- 1226 Owens Rd W
- 1212 Owens Rd W
- 1199 Owens Rd W
- 1194 Owens Rd W
- 1213 Owens Rd W
- 1354 Owens Rd W
- 1363 Owens Rd W
- 1177 Owens Rd W
- 1174 Owens Rd W
- 1163 Owens Rd W
- 0 Owens Rd W Unit 2612272
- 0 Owens Rd W Unit 1 2409416
- 0 Owens Rd W Unit 2122269
- 0 Owens Rd W
Your Personal Tour Guide
Ask me questions while you tour the home.