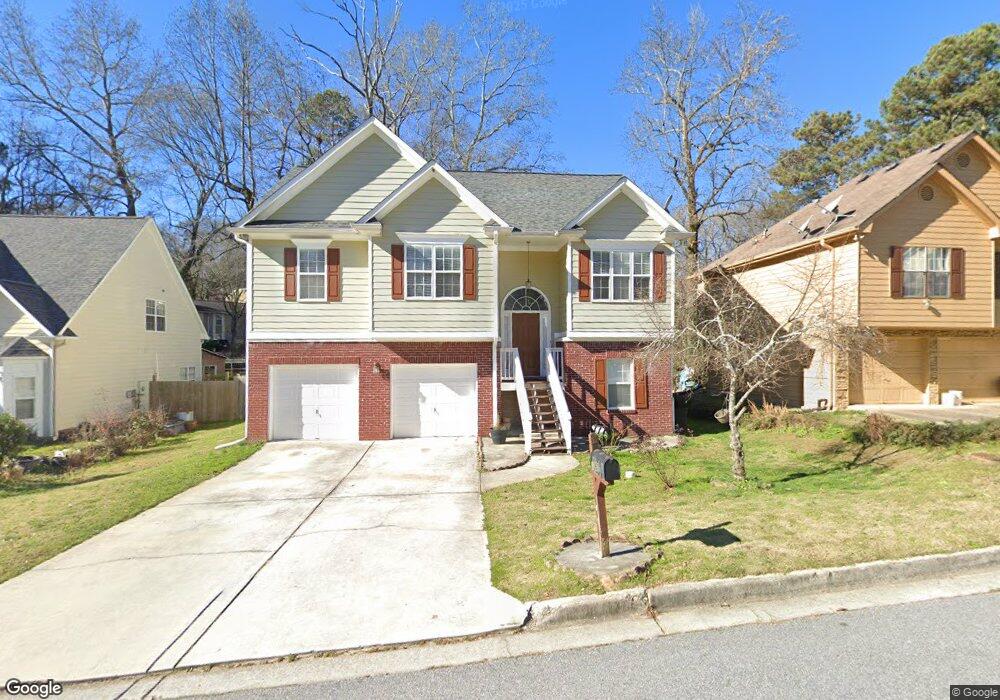
1267 Pounds Ln Clarkston, GA 30021
Estimated Value: $315,109 - $374,000
3
Beds
2
Baths
1,353
Sq Ft
$253/Sq Ft
Est. Value
About This Home
This home is located at 1267 Pounds Ln, Clarkston, GA 30021 and is currently estimated at $342,527, approximately $253 per square foot. 1267 Pounds Ln is a home located in DeKalb County with nearby schools including Jolly Elementary School, Freedom Middle School, and Clarkston High School.
Ownership History
Date
Name
Owned For
Owner Type
Purchase Details
Closed on
Jul 13, 2011
Sold by
Secretary Of Housing And U
Bought by
Neway Kiflu Azage and Neway Tium
Current Estimated Value
Home Financials for this Owner
Home Financials are based on the most recent Mortgage that was taken out on this home.
Original Mortgage
$105,250
Outstanding Balance
$72,216
Interest Rate
4.53%
Mortgage Type
FHA
Estimated Equity
$270,311
Purchase Details
Closed on
Nov 2, 2010
Sold by
Citimortgage Inc
Bought by
Hud-Housing Of Urban Dev
Purchase Details
Closed on
Mar 29, 2002
Sold by
Pounds Dev Llc
Bought by
Tassaw Berhane
Home Financials for this Owner
Home Financials are based on the most recent Mortgage that was taken out on this home.
Original Mortgage
$150,676
Interest Rate
6.8%
Mortgage Type
FHA
Purchase Details
Closed on
Nov 2, 2000
Sold by
Johnson David L
Bought by
Slate Howard
Create a Home Valuation Report for This Property
The Home Valuation Report is an in-depth analysis detailing your home's value as well as a comparison with similar homes in the area
Home Values in the Area
Average Home Value in this Area
Purchase History
| Date | Buyer | Sale Price | Title Company |
|---|---|---|---|
| Neway Kiflu Azage | $105,250 | -- | |
| Hud-Housing Of Urban Dev | -- | -- | |
| Citimortgage Inc | $152,366 | -- | |
| Tassaw Berhane | $151,900 | -- | |
| Slate Howard | -- | -- |
Source: Public Records
Mortgage History
| Date | Status | Borrower | Loan Amount |
|---|---|---|---|
| Open | Neway Kiflu Azage | $105,250 | |
| Previous Owner | Tassaw Berhane | $150,676 |
Source: Public Records
Tax History Compared to Growth
Tax History
| Year | Tax Paid | Tax Assessment Tax Assessment Total Assessment is a certain percentage of the fair market value that is determined by local assessors to be the total taxable value of land and additions on the property. | Land | Improvement |
|---|---|---|---|---|
| 2025 | $3,279 | $118,520 | $20,000 | $98,520 |
| 2024 | $3,428 | $121,640 | $20,000 | $101,640 |
| 2023 | $3,428 | $121,280 | $20,000 | $101,280 |
| 2022 | $3,209 | $114,880 | $20,000 | $94,880 |
| 2021 | $2,392 | $79,480 | $20,000 | $59,480 |
| 2020 | $2,131 | $67,960 | $6,800 | $61,160 |
| 2019 | $2,146 | $69,480 | $6,800 | $62,680 |
| 2018 | $1,835 | $62,800 | $6,800 | $56,000 |
| 2017 | $1,859 | $55,040 | $6,800 | $48,240 |
| 2016 | $1,599 | $48,840 | $6,800 | $42,040 |
| 2014 | $1,019 | $32,000 | $6,800 | $25,200 |
Source: Public Records
Map
Nearby Homes
- 1310 Brockett Place
- 3816 Prescott Ridge Cir Unit 30
- 1297 Tree Creek Ct
- 1362 Brockett Place Unit 1362
- 1172 Denison Dr
- 3647 Cobble Mill Ln Unit Ste B4
- 1186 Vaughan St
- 957 Texel Ln Unit 4
- 4549 Erskine Rd
- 3965 Camelot Ct
- 3722 S Marlborough Dr
- 907 E Green Ln
- 1111 Gunnison Ct Unit 4
- 4074 Idlevale Dr
- 1367 Wenlock Edge Cove
- 3952 Cedar Cir
- 3819 Cottage Cir
- 911 E Green Ln
- 3630 Prince Way
- 4201 Church St
- 1261 Pounds Ln
- 1271 Pounds Ln
- 0 Pounds Ln Unit 7450625
- 0 Pounds Ln Unit 3132662
- 1257 Pounds Ln
- 1275 Pounds Ln
- 1266 Pounds Ln
- 1270 Pounds Ln
- 1260 Pounds Ln
- 1251 Pounds Ln
- 1281 Pounds Ln
- 1256 Pounds Ln Unit n/a
- 1256 Pounds Ln
- 1274 Pounds Ln
- 1247 Pounds Ln
- 1285 Pounds Ln
- 1280 Pounds Ln
- 1250 Pounds Ln
- 1246 Pounds Ln
- 1284 Pounds Ln