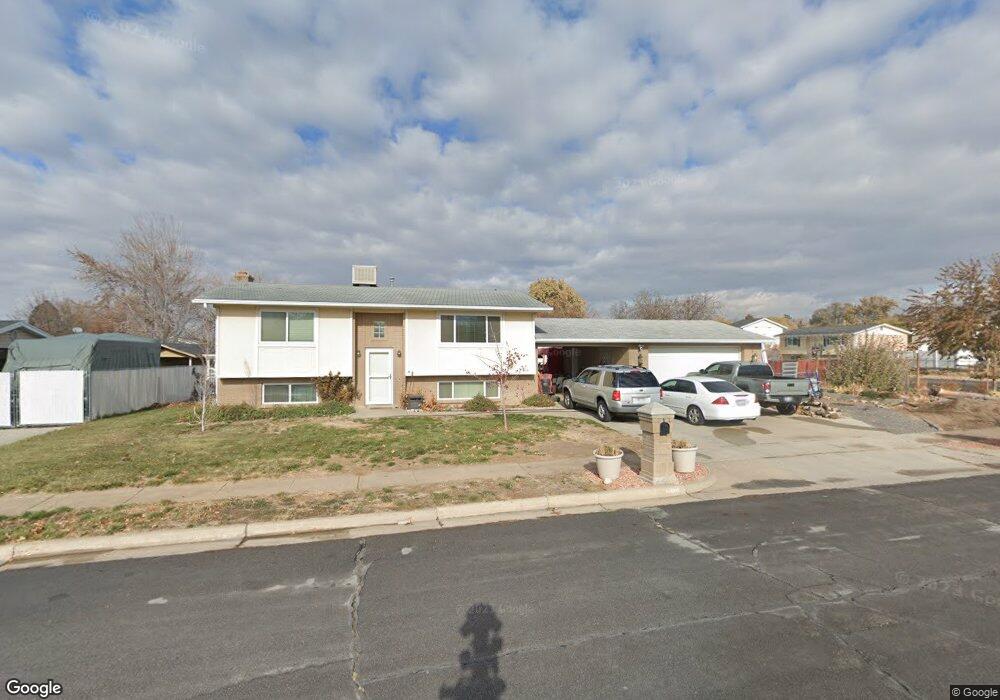
1268 W 2175 N Clearfield, UT 84015
Estimated Value: $404,000 - $435,747
4
Beds
2
Baths
1,896
Sq Ft
$222/Sq Ft
Est. Value
About This Home
This home is located at 1268 W 2175 N, Clearfield, UT 84015 and is currently estimated at $420,687, approximately $221 per square foot. 1268 W 2175 N is a home located in Davis County with nearby schools including Parkside Elementary School, Sunset Junior High School, and Clearfield High School.
Ownership History
Date
Name
Owned For
Owner Type
Purchase Details
Closed on
Jul 11, 2023
Sold by
Robbins Family Revocable Trust
Bought by
Robbins Jacob
Current Estimated Value
Home Financials for this Owner
Home Financials are based on the most recent Mortgage that was taken out on this home.
Original Mortgage
$385,000
Outstanding Balance
$347,340
Interest Rate
6.18%
Mortgage Type
Balloon
Estimated Equity
$73,347
Purchase Details
Closed on
Aug 26, 2021
Sold by
Robbins Bicknell Pierce and Robbins Pam
Bought by
Robbins Bicknell P and Robbins Pamela J
Purchase Details
Closed on
Jan 9, 2001
Sold by
Kellos Darold J and Kellos Mary Lou
Bought by
Robbins Bicknell Pierce and Robbins Pam
Home Financials for this Owner
Home Financials are based on the most recent Mortgage that was taken out on this home.
Original Mortgage
$123,642
Interest Rate
7.65%
Mortgage Type
FHA
Create a Home Valuation Report for This Property
The Home Valuation Report is an in-depth analysis detailing your home's value as well as a comparison with similar homes in the area
Home Values in the Area
Average Home Value in this Area
Purchase History
| Date | Buyer | Sale Price | Title Company |
|---|---|---|---|
| Robbins Jacob | -- | Inwest Title | |
| Robbins Bicknell P | -- | None Available | |
| Robbins Bicknell Pierce | -- | Founders Title Co |
Source: Public Records
Mortgage History
| Date | Status | Borrower | Loan Amount |
|---|---|---|---|
| Open | Robbins Jacob | $385,000 | |
| Previous Owner | Robbins Bicknell Pierce | $123,642 |
Source: Public Records
Tax History Compared to Growth
Tax History
| Year | Tax Paid | Tax Assessment Tax Assessment Total Assessment is a certain percentage of the fair market value that is determined by local assessors to be the total taxable value of land and additions on the property. | Land | Improvement |
|---|---|---|---|---|
| 2025 | $2,168 | $208,450 | $90,632 | $117,818 |
| 2024 | $2,122 | $205,150 | $99,118 | $106,032 |
| 2023 | $1,918 | $343,000 | $113,659 | $229,341 |
| 2022 | $2,035 | $201,300 | $68,445 | $132,855 |
| 2021 | $1,881 | $276,000 | $87,517 | $188,483 |
| 2020 | $1,625 | $236,000 | $75,350 | $160,650 |
| 2019 | $1,607 | $228,000 | $86,232 | $141,768 |
| 2018 | $1,470 | $205,000 | $76,421 | $128,579 |
| 2016 | $1,177 | $84,700 | $29,973 | $54,727 |
| 2015 | $1,180 | $80,795 | $29,973 | $50,822 |
| 2014 | $1,066 | $74,143 | $29,973 | $44,170 |
| 2013 | -- | $70,274 | $25,230 | $45,044 |
Source: Public Records
Map
Nearby Homes