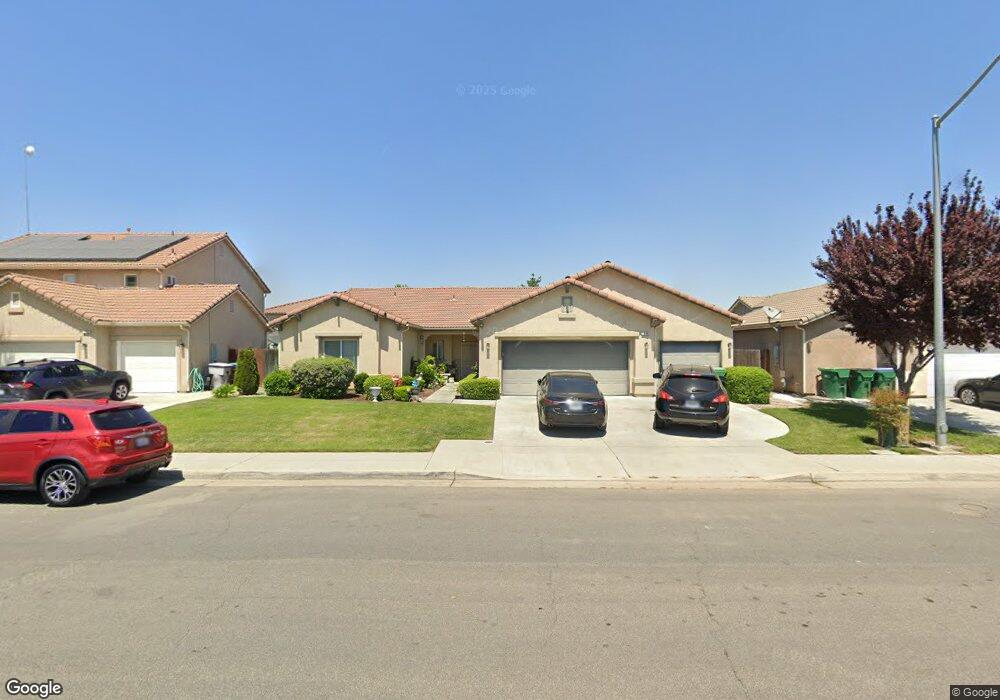
1268 W Nelson Ave Fowler, CA 93625
Estimated Value: $457,000 - $528,000
About This Home
This home is located at 1268 W Nelson Ave, Fowler, CA 93625 and is currently estimated at $495,387, approximately $243 per square foot. 1268 W Nelson Ave is a home located in Fresno County with nearby schools including Fremont Elementary School, Marshall Elementary School, and John Sutter Middle School.
Ownership History
We collect this data history from publicly available records. To have your information removed, we recommend requesting removal directly through your county’s website.
Purchase Details
Purchase Details
Purchase Details
Home Financials for this Owner
Home Financials are based on the most recent Mortgage that was taken out on this home.Purchase Details
Home Financials for this Owner
Home Financials are based on the most recent Mortgage that was taken out on this home.Home Values in the Area
Average Home Value in this Area
Purchase History
We collect this data history from publicly available records. To have your information removed, we recommend requesting removal directly through your county’s website.
| Date | Buyer | Sale Price | Title Company |
|---|---|---|---|
| $205,000 | Chicago Title Company | ||
| $187,790 | Accommodation | ||
| $295,000 | Chicago Title Company | ||
| -- | Chicago Title Company |
Mortgage History
We collect this data history from publicly available records. To have your information removed, we recommend requesting removal directly through your county’s website.
| Date | Status | Borrower | Loan Amount |
|---|---|---|---|
| Previous Owner | $236,000 | ||
| Previous Owner | $59,000 |
Tax History
We collect this data history from publicly available records. To have your information removed, we recommend requesting removal directly through your county’s website.
| Year | Tax Paid | Tax Assessment Tax Assessment Total Assessment is a certain percentage of the fair market value that is determined by local assessors to be the total taxable value of land and additions on the property. | Land | Improvement |
|---|---|---|---|---|
| 2025 | $3,727 | $264,606 | $65,826 | $198,780 |
| 2023 | $3,397 | $254,333 | $63,271 | $191,062 |
| 2022 | $3,339 | $249,347 | $62,031 | $187,316 |
| 2021 | $3,256 | $244,459 | $60,815 | $183,644 |
| 2020 | $3,231 | $241,953 | $60,192 | $181,761 |
| 2019 | $3,205 | $237,210 | $59,012 | $178,198 |
| 2018 | $3,153 | $232,559 | $57,855 | $174,704 |
| 2017 | $3,075 | $228,000 | $56,721 | $171,279 |
| 2016 | $2,792 | $223,530 | $55,609 | $167,921 |
| 2015 | $2,793 | $220,173 | $54,774 | $165,399 |
| 2014 | $2,638 | $207,800 | $47,500 | $160,300 |
Map
- 969 S Kandarian Ct
- 312 W Tuolumne St
- 118 N 9th St
- 325 N 7th St
- 508 N 6th St
- 153 Bonita Ave
- 1392 W Clara Ave
- 1001 Lucia Ave
- 1015 Lucia Ave
- 217 S 7th St
- 1451 W Ryan Ave
- 430 S 6th St
- 5250 E Adams Ave
- 8353 S Fowler Ave
- 8138 S Kenneth Ave
- 6658 S Peach Ave
- 5665 S Chestnut Ave Unit 3
- 5747 S Clovis Ave
- 9693 S Golden State Blvd
- 5414 E Floral Ave
- 1245 W Walter Ave
- 1245 W Walter Ave Unit 9
- 1245 W Walter Ave Unit 8
- 1245 W Walter Ave Unit 7
- 1245 W Walter Ave Unit 6
- 1245 W Walter Ave Unit 5
- 1245 W Walter Ave Unit 4
- 1281 W Walter Ave Unit 13
- 1281 W Walter Ave Unit 14
- 1281 W Walter Ave Unit 12
- 1281 W Walter Ave Unit 10
- 1282 W Walter Ave Unit 17
- 1282 W Walter Ave Unit 19
- 1282 W Walter Ave Unit 21
- 1282 W Walter Ave Unit 18
- 1282 W Walter Ave Unit 16
- 1282 W Walter Ave Unit 20
- 1244 W Walter Ave Unit 26
- 1244 W Walter Ave Unit 27
- 1244 W Walter Ave Unit 22
Ask me questions while you tour the home.