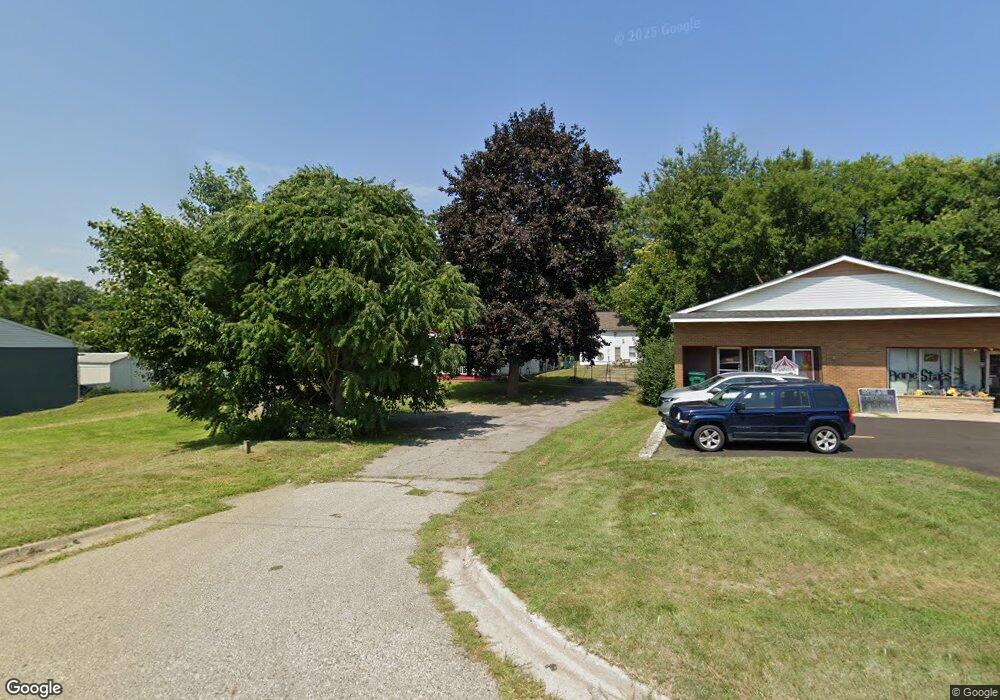
1269 E Michigan Ave Ypsilanti, MI 48198
Estimated Value: $299,000 - $481,000
7
Beds
2
Baths
2,022
Sq Ft
$174/Sq Ft
Est. Value
About This Home
This home is located at 1269 E Michigan Ave, Ypsilanti, MI 48198 and is currently estimated at $352,369, approximately $174 per square foot. 1269 E Michigan Ave is a home located in Washtenaw County with nearby schools including Holmes Elementary School, Erickson Elementary School, and Estabrook Elementary School.
Ownership History
Date
Name
Owned For
Owner Type
Purchase Details
Closed on
Feb 1, 2017
Sold by
Jameson Onyebuchi
Bought by
Onyebuchi Cecilia
Current Estimated Value
Purchase Details
Closed on
Feb 19, 2012
Sold by
Sims Gary
Bought by
Onyebuchi Jameson
Purchase Details
Closed on
Feb 14, 2011
Sold by
Jameson Onyebuchi and Onyebuchi Cecilia
Bought by
Sims Gary
Purchase Details
Closed on
Oct 12, 2010
Sold by
Ohaeri Chika
Bought by
Onyebuchi Jameson and Onyebuchi Cecilia
Purchase Details
Closed on
Oct 22, 2007
Sold by
Jameson Onyebuchi and Onyebuchi Cecilia
Bought by
Ohaeri Chika
Purchase Details
Closed on
Jun 2, 2005
Sold by
Eugene & Vada Faye Hunt Living Trust
Bought by
Onyebuchi Jameson and Onyebuchi Cecilia
Purchase Details
Closed on
Aug 20, 2004
Sold by
Hunt Vada Faye and Hunt Eugene R
Bought by
Eugene & Vada Faye Hunt Living Trust
Purchase Details
Closed on
Jun 12, 2001
Sold by
Onyebuchi Cecilia
Bought by
Onyebuchi Jameson
Create a Home Valuation Report for This Property
The Home Valuation Report is an in-depth analysis detailing your home's value as well as a comparison with similar homes in the area
Home Values in the Area
Average Home Value in this Area
Purchase History
| Date | Buyer | Sale Price | Title Company |
|---|---|---|---|
| Onyebuchi Cecilia | -- | None Available | |
| Onyebuchi Jameson | -- | None Available | |
| Sims Gary | $13,500 | Etitle Agency Inc | |
| Onyebuchi Jameson | -- | None Available | |
| Ohaeri Chika | -- | None Available | |
| Onyebuchi Jameson | $250,000 | Metropolitan Title Company | |
| Eugene & Vada Faye Hunt Living Trust | -- | -- | |
| Onyebuchi Jameson | -- | None Available |
Source: Public Records
Tax History Compared to Growth
Tax History
| Year | Tax Paid | Tax Assessment Tax Assessment Total Assessment is a certain percentage of the fair market value that is determined by local assessors to be the total taxable value of land and additions on the property. | Land | Improvement |
|---|---|---|---|---|
| 2025 | -- | $140,700 | $0 | $0 |
| 2024 | -- | $137,900 | $0 | $0 |
| 2023 | $5,347 | $109,000 | $0 | $0 |
| 2022 | $5,347 | $117,100 | $0 | $0 |
| 2021 | $5,347 | $112,900 | $0 | $0 |
| 2020 | $5,347 | $85,900 | $0 | $0 |
| 2019 | $5,347 | $82,700 | $82,700 | $0 |
| 2018 | $3,987 | $87,300 | $0 | $0 |
| 2017 | $3,987 | $84,400 | $0 | $0 |
| 2016 | $4,001 | $75,683 | $0 | $0 |
| 2015 | $3,788 | $75,457 | $0 | $0 |
| 2014 | $3,788 | $73,100 | $0 | $0 |
| 2013 | -- | $73,100 | $0 | $0 |
Source: Public Records
Map
Nearby Homes
- 142 Glenwood Ave
- 819 N Harris Rd
- 366 S Harris Rd
- 1320 Parkwood Ave
- 1027 Parkwood Ave
- 211 Devonshire St
- 1066 Holmes Rd
- 207 Oregon St
- 278 Oregon St
- 823 Hawthorne Ave
- 708 Virginia Place
- 339 Ohio St
- 712 E Forest Ave
- 909 Maplewood Ave
- 808 Lamay Ave
- 204 Ecorse Rd
- 1060 Commonwealth Ave
- 490 Greenlawn St
- 270 Ohio St
- VACANT Ecorse Rd
- 1293 E Michigan Ave
- 39 Burbank Ave
- 1255 E Michigan Ave
- 40 Burbank Ave
- 40 Burbank Ave
- 1250 E Cross St
- 1262 E Cross St
- 55 Burbank Ave Unit 2
- 55 Burbank Ave Unit 5
- 55 Burbank Ave
- 1189 E Michigan Ave
- 1240 E Cross St
- 80 Burbank Ave
- 1215 E Michigan Ave
- 1294 E Michigan Ave
- 1236 E Cross St
- 1298 E Michigan Ave
- 1326 E Cross St
- 1230 E Cross St
- 1255 E Cross St