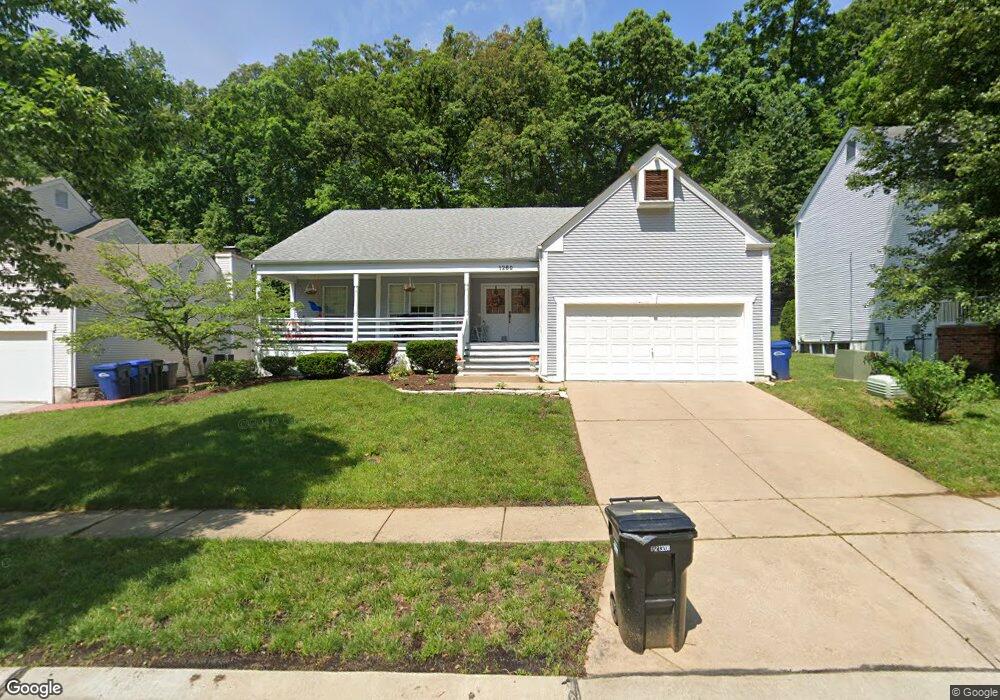
1269 Red Oak Plantation Dr Ballwin, MO 63021
Estimated Value: $400,878 - $543,000
3
Beds
2
Baths
1,782
Sq Ft
$258/Sq Ft
Est. Value
About This Home
This home is located at 1269 Red Oak Plantation Dr, Ballwin, MO 63021 and is currently estimated at $459,470, approximately $257 per square foot. 1269 Red Oak Plantation Dr is a home located in St. Louis County with nearby schools including Oak Brook Elementary School, Parkway Southwest Middle School, and Parkway South High School.
Ownership History
Date
Name
Owned For
Owner Type
Purchase Details
Closed on
Aug 9, 2019
Sold by
Hulbert Andrew S and Hulbert Crystal M
Bought by
Hulbert Andrew S and Hulbert Crystal M
Current Estimated Value
Home Financials for this Owner
Home Financials are based on the most recent Mortgage that was taken out on this home.
Original Mortgage
$206,600
Outstanding Balance
$136,289
Interest Rate
3.7%
Mortgage Type
New Conventional
Estimated Equity
$323,181
Purchase Details
Closed on
Oct 9, 2013
Sold by
Falch Wayne David
Bought by
Hulbert Andrew J and Rosner Crystal M
Home Financials for this Owner
Home Financials are based on the most recent Mortgage that was taken out on this home.
Original Mortgage
$217,750
Interest Rate
4.61%
Mortgage Type
New Conventional
Purchase Details
Closed on
Sep 10, 2004
Sold by
Falch Dorothy and Falch Wayne David
Bought by
Falch Wayne David and Falch Nancy
Purchase Details
Closed on
Nov 12, 1998
Sold by
Dorothy Falch
Bought by
Falch Wayne David and Falch Dorothy
Create a Home Valuation Report for This Property
The Home Valuation Report is an in-depth analysis detailing your home's value as well as a comparison with similar homes in the area
Home Values in the Area
Average Home Value in this Area
Purchase History
| Date | Buyer | Sale Price | Title Company |
|---|---|---|---|
| Hulbert Andrew S | -- | Continental Title Holding Co | |
| Hulbert Andrew J | $229,240 | Integrity Land Title Co Inc | |
| Falch Wayne David | -- | -- | |
| Falch Wayne David | -- | -- |
Source: Public Records
Mortgage History
| Date | Status | Borrower | Loan Amount |
|---|---|---|---|
| Open | Hulbert Andrew S | $206,600 | |
| Closed | Hulbert Andrew J | $217,750 |
Source: Public Records
Tax History
| Year | Tax Paid | Tax Assessment Tax Assessment Total Assessment is a certain percentage of the fair market value that is determined by local assessors to be the total taxable value of land and additions on the property. | Land | Improvement |
|---|---|---|---|---|
| 2025 | $4,304 | $78,000 | $37,450 | $40,550 |
| 2024 | $4,304 | $66,430 | $19,990 | $46,440 |
| 2023 | $4,304 | $66,430 | $19,990 | $46,440 |
| 2022 | $4,236 | $60,290 | $19,990 | $40,300 |
| 2021 | $4,212 | $60,290 | $19,990 | $40,300 |
| 2020 | $3,985 | $54,040 | $19,990 | $34,050 |
| 2019 | $3,940 | $54,040 | $19,990 | $34,050 |
| 2018 | $3,897 | $49,590 | $19,990 | $29,600 |
| 2017 | $3,786 | $49,590 | $19,990 | $29,600 |
| 2016 | $3,575 | $44,530 | $12,480 | $32,050 |
| 2015 | $3,742 | $44,530 | $12,480 | $32,050 |
| 2014 | $3,142 | $39,900 | $11,380 | $28,520 |
Source: Public Records
Map
Nearby Homes
- 1239 Bedford Falls Ct
- 1389 Red Oak Plantation Dr
- 461 Elm Crossing Ct
- 540 Woodlyn Crossing
- 537 Treetop Village Dr
- 1545 Greenfield Crossing Ct
- 557 Woodlyn Crossing
- 564 Woodlyn Crossing
- 134 Cascade Terrace Dr
- 284 Brightfield Dr
- 1337 Stone Run Dr
- 702 Lofty Point Dr Unit C
- 711 Lofty Point Dr Unit C
- 22 Morning Hill Dr Unit 204
- 1622 Forest Springs Ln Unit A
- 1626 Forest Springs Ln Unit C
- 417 Palermo Dr
- 899 Oklahoma Ave
- 706 Eaglebrooke Dr
- 1316 Westbrooke Terrace Dr
- 1265 Red Oak Plantation Dr
- 1273 Red Oak Plantation Dr
- 1261 Red Oak Plantation Dr
- 1277 Red Oak Plantation Dr
- 1257 Red Oak Plantation Dr
- 1281 Red Oak Plantation Dr
- 397 Lauren Landing
- 1270 Red Oak Plantation Dr
- 1266 Red Oak Plantation Dr
- 1274 Red Oak Plantation Dr
- 1262 Red Oak Plantation Dr
- 1278 Red Oak Plantation Dr
- 391 Lauren Landing
- 1253 Red Oak Plantation Dr
- 1258 Red Oak Plantation Dr
- 395 Lauren Landing
- 1282 Red Oak Plantation Dr
- 1271 Arbor Summit Dr
- 1254 Red Oak Plantation Dr
- 1249 Red Oak Plantation Dr
Your Personal Tour Guide
Ask me questions while you tour the home.