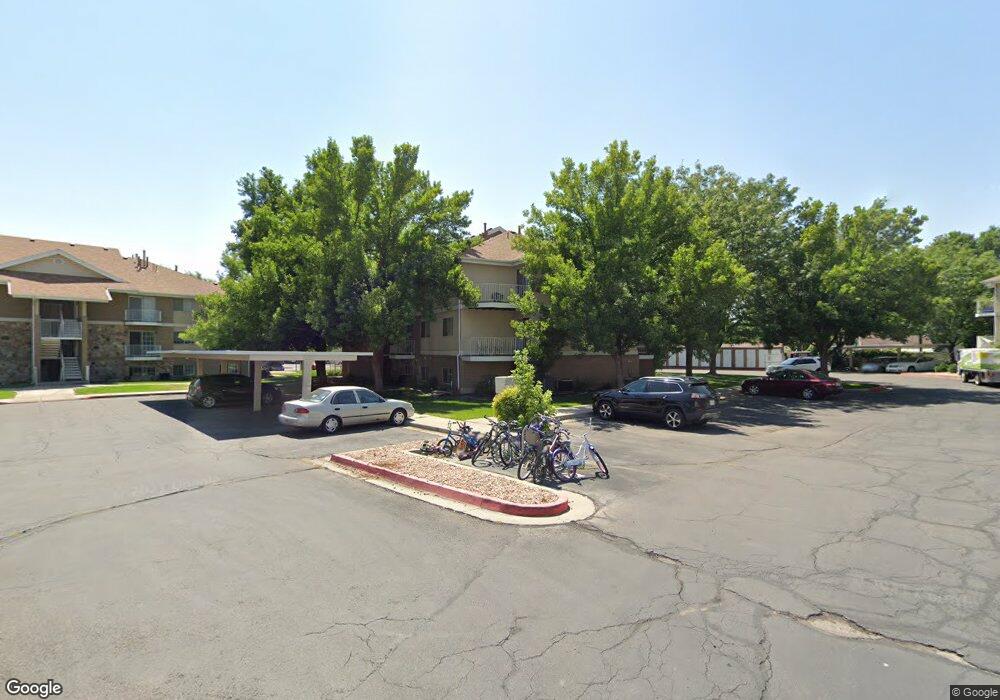
1269 Riverside Ave Provo, UT 84604
Rivergrove NeighborhoodEstimated Value: $290,617 - $340,000
3
Beds
1
Bath
957
Sq Ft
$317/Sq Ft
Est. Value
About This Home
This home is located at 1269 Riverside Ave, Provo, UT 84604 and is currently estimated at $303,654, approximately $317 per square foot. 1269 Riverside Ave is a home located in Utah County with nearby schools including Westridge Elementary School, Dixon Middle School, and Provo High School.
Ownership History
Date
Name
Owned For
Owner Type
Purchase Details
Closed on
Jul 17, 2023
Sold by
Cherry Investing Llc
Bought by
Trych Pavel and Trych Alena
Current Estimated Value
Home Financials for this Owner
Home Financials are based on the most recent Mortgage that was taken out on this home.
Original Mortgage
$223,500
Outstanding Balance
$217,184
Interest Rate
6.71%
Mortgage Type
New Conventional
Estimated Equity
$86,470
Purchase Details
Closed on
Apr 10, 2018
Sold by
Parker Done
Bought by
Cherry Investing Llc
Purchase Details
Closed on
Dec 28, 2016
Sold by
Jkj Management Llc
Bought by
Parker Dane
Home Financials for this Owner
Home Financials are based on the most recent Mortgage that was taken out on this home.
Original Mortgage
$99,000
Interest Rate
3.94%
Mortgage Type
New Conventional
Purchase Details
Closed on
Apr 30, 2007
Sold by
Jones James Walter and Jones Karen C
Bought by
Jkj Management Llc
Purchase Details
Closed on
Apr 16, 2007
Sold by
Blake Helen P
Bought by
Jones James Walter and Jones Karen C
Create a Home Valuation Report for This Property
The Home Valuation Report is an in-depth analysis detailing your home's value as well as a comparison with similar homes in the area
Home Values in the Area
Average Home Value in this Area
Purchase History
| Date | Buyer | Sale Price | Title Company |
|---|---|---|---|
| Trych Pavel | -- | Cottonwood Title | |
| Cherry Investing Llc | -- | Access Title Co | |
| Parker Dane | -- | Inwest Title | |
| Jkj Management Llc | -- | First American Title Pine | |
| Jones James Walter | -- | First American Title Pine |
Source: Public Records
Mortgage History
| Date | Status | Borrower | Loan Amount |
|---|---|---|---|
| Open | Trych Pavel | $223,500 | |
| Previous Owner | Parker Dane | $99,000 |
Source: Public Records
Tax History
| Year | Tax Paid | Tax Assessment Tax Assessment Total Assessment is a certain percentage of the fair market value that is determined by local assessors to be the total taxable value of land and additions on the property. | Land | Improvement |
|---|---|---|---|---|
| 2025 | $1,545 | $154,715 | -- | -- |
| 2024 | $1,545 | $152,075 | $0 | $0 |
| 2023 | $1,563 | $151,635 | $0 | $0 |
| 2022 | $1,500 | $146,740 | $0 | $0 |
| 2021 | $1,260 | $215,100 | $25,800 | $189,300 |
| 2020 | $1,243 | $198,900 | $23,900 | $175,000 |
| 2019 | $1,082 | $180,000 | $23,500 | $156,500 |
| 2018 | $960 | $162,000 | $20,200 | $141,800 |
| 2017 | $854 | $79,200 | $0 | $0 |
| 2016 | $848 | $73,315 | $0 | $0 |
| 2015 | $807 | $70,510 | $0 | $0 |
| 2014 | $774 | $70,510 | $0 | $0 |
Source: Public Records
Map
Nearby Homes
- 1273 Riverside Ave Unit 6
- 1250 Riverside Ave
- 880 W 1020 N
- 1058 N 1000 W
- 1533 N 550 W Unit 26
- 920 W Columbia Ln
- 668 W 890 N
- 1638 Woodland Dr
- 879 N 750 W
- 1676 Hickory Ln
- 1674 Hickory Ln
- 1662 Willowbrook Dr
- 1470 N 380 W
- 881 N 950 W
- 830 N 750 W
- 1254 N 1220 W
- 1763 Willowbrook Dr Unit 4D1
- 1174 W 1050 N
- 810 N 600 W
- 556 W 800 N Unit 18
- 1269 Riverside Ave
- 1269 Riverside Ave Unit 22
- 1269 Riverside Ave Unit 21
- 1269 Riverside Ave Unit 20
- 1269 Riverside Ave Unit 19
- 1269 Riverside Ave
- 1269 Riverside Ave
- 1269 Riverside Ave Unit 16
- 1269 Riverside Ave Unit 15
- 1269 Riverside Ave
- 1269 Riverside Ave Unit 24
- 1269 Riverside Ave
- 1269 Riverside Ave Unit 18
- 1269 Riverside Ave Unit 17
- 1269 Riverside Ave Unit 14
- 1269 Riverside Ave Unit 13
- 1303 Riverside Ave
- 1303 Riverside Ave Unit 34
- 1303 Riverside Ave Unit 33
- 1303 Riverside Ave Unit 31
Your Personal Tour Guide
Ask me questions while you tour the home.