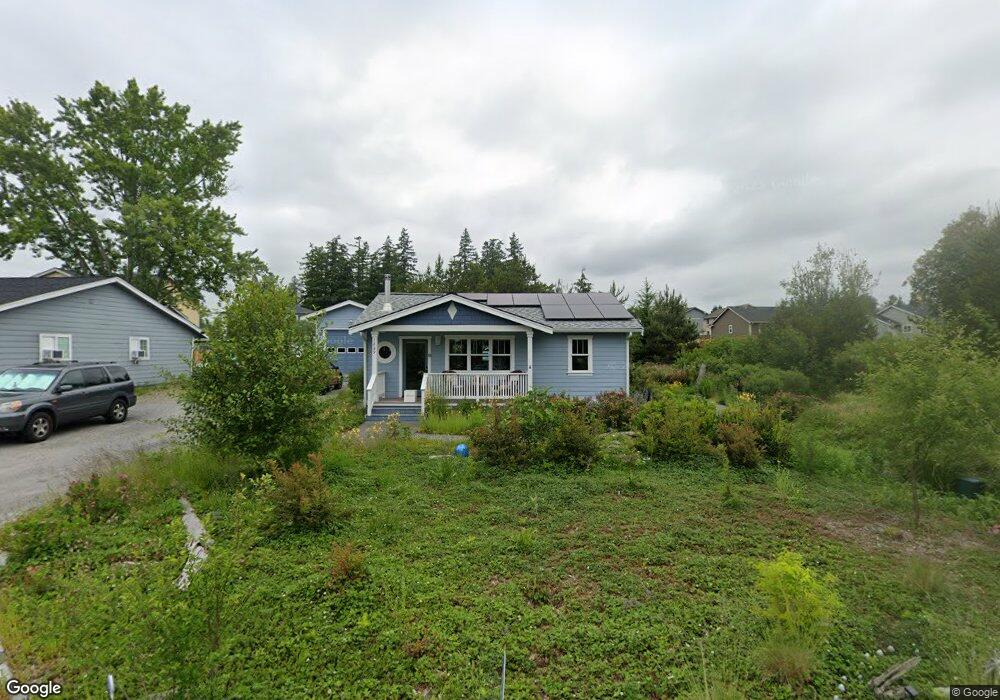
1269 Runge Ave Blaine, WA 98230
Estimated Value: $425,000 - $485,000
2
Beds
1
Bath
828
Sq Ft
$537/Sq Ft
Est. Value
About This Home
This home is located at 1269 Runge Ave, Blaine, WA 98230 and is currently estimated at $444,644, approximately $537 per square foot. 1269 Runge Ave is a home located in Whatcom County with nearby schools including Blaine Primary School, Blaine Elementary School, and Blaine Middle School.
Ownership History
Date
Name
Owned For
Owner Type
Purchase Details
Closed on
May 8, 2015
Sold by
Grant Margarette and Estate Of James A Ross
Bought by
Grant Margarette and Ross James A
Current Estimated Value
Purchase Details
Closed on
Apr 30, 2008
Sold by
Lamphier Brent and Lamphier Stacy
Bought by
Ross James A and Grant Margarette A
Home Financials for this Owner
Home Financials are based on the most recent Mortgage that was taken out on this home.
Original Mortgage
$99,000
Outstanding Balance
$62,433
Interest Rate
5.8%
Mortgage Type
Purchase Money Mortgage
Estimated Equity
$382,211
Purchase Details
Closed on
Apr 6, 1999
Sold by
Wiggin Earl L and Wiggin Cheryl S
Bought by
Barnhart Daymond R and Barnhart Cheryl A
Home Financials for this Owner
Home Financials are based on the most recent Mortgage that was taken out on this home.
Original Mortgage
$58,000
Interest Rate
6.91%
Create a Home Valuation Report for This Property
The Home Valuation Report is an in-depth analysis detailing your home's value as well as a comparison with similar homes in the area
Home Values in the Area
Average Home Value in this Area
Purchase History
| Date | Buyer | Sale Price | Title Company |
|---|---|---|---|
| Grant Margarette | -- | None Available | |
| Ross James A | $199,280 | Whatcom Land Title | |
| Barnhart Daymond R | $72,500 | Island Title Company |
Source: Public Records
Mortgage History
| Date | Status | Borrower | Loan Amount |
|---|---|---|---|
| Open | Ross James A | $99,000 | |
| Previous Owner | Barnhart Daymond R | $58,000 |
Source: Public Records
Tax History Compared to Growth
Tax History
| Year | Tax Paid | Tax Assessment Tax Assessment Total Assessment is a certain percentage of the fair market value that is determined by local assessors to be the total taxable value of land and additions on the property. | Land | Improvement |
|---|---|---|---|---|
| 2024 | $2,838 | $421,353 | $177,600 | $243,753 |
| 2023 | $2,838 | $421,353 | $177,600 | $243,753 |
| 2022 | $2,556 | $379,597 | $160,000 | $219,597 |
| 2021 | $2,437 | $292,851 | $132,112 | $160,739 |
| 2020 | $2,319 | $254,653 | $114,880 | $139,773 |
| 2019 | $2,160 | $233,196 | $105,200 | $127,996 |
| 2018 | $1,737 | $211,915 | $95,600 | $116,315 |
| 2017 | $1,420 | $153,459 | $80,000 | $73,459 |
| 2016 | $1,575 | $140,725 | $80,000 | $60,725 |
| 2015 | $1,432 | $150,581 | $90,597 | $59,984 |
| 2014 | -- | $133,732 | $86,698 | $47,034 |
| 2013 | -- | $132,272 | $85,750 | $46,522 |
Source: Public Records
Map
Nearby Homes
- 1301 Leighton St
- 1263 Leighton St
- 2529 Bora Ct
- 8055 Blaine Rd
- 2240 Peace Portal Dr Unit 5
- 1985 Bayview Ave
- 0 Shipyard Rd
- 1649 Bayview Ave
- 1575 Kingsley Ave
- 750 Odell Rd
- 1384 Bayview Ct Unit E1
- 1301 Mitchell Ave
- 1428 Peace Portal Dr
- 1333 Harrison Ave
- 1260 Harrison Ave
- 1190 Blaine Ave
- 4255 West Rd
- 1300 Peace Portal Dr Unit 106
- 1273 4th St Unit 1 & 2
- 549 Cherry St
- 1267 Runge Ave
- 1479 Runge Ave
- 1265 Runge Ave
- 1264 Runge Ave
- 1375 Leighton St
- 1425 Leighton St
- 1281 Runge Ave
- 1410 Runge Ave
- 1285 Runge Ave
- 1128 Leighton St
- 1285 Leighton St
- 1429 Leighton St
- 1225 Runge Ave
- 1403 Runge Ave
- 2574 Bora Bora Ct
- 1428 Runge Ave
- 1314 Leighton St
- 1433 Leighton St
- 2545 Baldwin Place
- 1441 Runge Ave