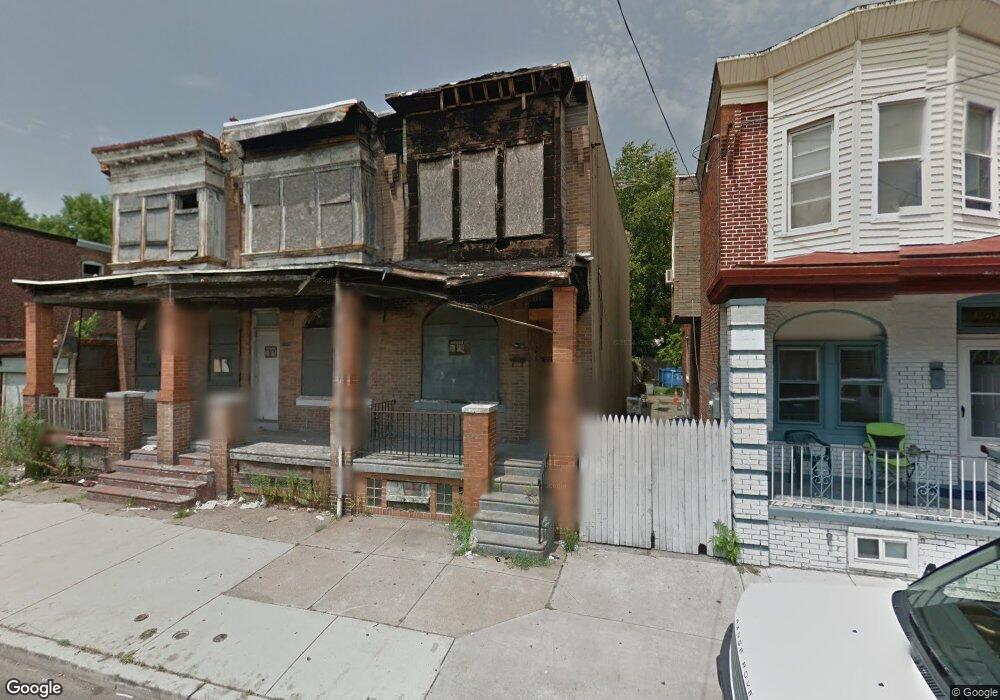
1269 Sheridan St Camden, NJ 08104
Whitman Park NeighborhoodEstimated Value: $108,014 - $165,000
3
Beds
1
Bath
1,257
Sq Ft
$112/Sq Ft
Est. Value
About This Home
This home is located at 1269 Sheridan St, Camden, NJ 08104 and is currently estimated at $141,004, approximately $112 per square foot. 1269 Sheridan St is a home located in Camden County with nearby schools including Camden High School and Freedom Prep Charter School.
Ownership History
Date
Name
Owned For
Owner Type
Purchase Details
Closed on
Aug 7, 2019
Sold by
Pciii Reo Llc
Bought by
Taveras Francisco Vargas
Current Estimated Value
Purchase Details
Closed on
Jun 19, 2019
Sold by
Mazahreh Basem
Bought by
Tavers Francisco Vargas
Purchase Details
Closed on
Oct 25, 2018
Sold by
Fajando Anyolina and Fajando Manuel
Bought by
Vargas Francisco A
Purchase Details
Closed on
May 23, 2014
Sold by
Farhat Arafat
Bought by
Fajardo Manuel and Fajardo Anyolina
Purchase Details
Closed on
Aug 3, 2009
Sold by
Farhat Anwar and Farhat Arafat
Bought by
Farhat Arafat
Purchase Details
Closed on
Sep 15, 2008
Sold by
Wasko Theresa and Kerney Theresa
Bought by
Farhat Anwar and Farhat Arafat
Home Financials for this Owner
Home Financials are based on the most recent Mortgage that was taken out on this home.
Original Mortgage
$3,000
Interest Rate
6.47%
Mortgage Type
Purchase Money Mortgage
Create a Home Valuation Report for This Property
The Home Valuation Report is an in-depth analysis detailing your home's value as well as a comparison with similar homes in the area
Home Values in the Area
Average Home Value in this Area
Purchase History
| Date | Buyer | Sale Price | Title Company |
|---|---|---|---|
| Taveras Francisco Vargas | $17,900 | Surety Title Company | |
| Tavers Francisco Vargas | $17,000 | Cape Atlantic Title Agcy Llc | |
| Vargas Francisco A | -- | None Available | |
| Fajardo Manuel | $3,000 | Fidelity Title Abstract Co | |
| Farhat Arafat | -- | -- | |
| Farhat Anwar | $4,000 | -- |
Source: Public Records
Mortgage History
| Date | Status | Borrower | Loan Amount |
|---|---|---|---|
| Previous Owner | Farhat Anwar | $3,000 |
Source: Public Records
Tax History Compared to Growth
Tax History
| Year | Tax Paid | Tax Assessment Tax Assessment Total Assessment is a certain percentage of the fair market value that is determined by local assessors to be the total taxable value of land and additions on the property. | Land | Improvement |
|---|---|---|---|---|
| 2025 | $1,286 | $36,300 | $5,600 | $30,700 |
| 2024 | $1,243 | $36,300 | $5,600 | $30,700 |
| 2023 | $1,243 | $36,300 | $5,600 | $30,700 |
| 2022 | $296 | $8,800 | $0 | $0 |
| 2021 | $295 | $8,800 | $0 | $0 |
| 2020 | $280 | $8,800 | $0 | $0 |
| 2019 | $268 | $36,300 | $5,600 | $30,700 |
| 2018 | $267 | $36,300 | $5,600 | $30,700 |
| 2017 | $260 | $8,800 | $5,600 | $3,200 |
| 2016 | $252 | $8,800 | $5,600 | $3,200 |
| 2015 | $242 | $8,800 | $5,600 | $3,200 |
| 2014 | $237 | $8,800 | $5,600 | $3,200 |
Source: Public Records
Map
Nearby Homes
- 1270 Jackson St
- 1281 Jackson St
- 1239 Jackson St
- 1240 Chase St
- 1230 Chase St
- 1257 Chase St
- 1245 Chase St
- 1216 Sheridan St
- 1613 Louis St
- 1218 Morton St
- 1216 Morton St
- 1352 Carl Miller Blvd
- 1606 Pershing St
- 1183 Chase St
- 1574 Mount Ephraim Ave
- 1165 Morton St
- 1275 Everett St
- 1139 Lowell St
- 1097 Morton St
- 1327 Lansdowne Ave
- 1267 Sheridan St
- 1271 Sheridan St
- 1273 Sheridan St
- 1261 Sheridan St
- 1275 Sheridan St
- 1279 Sheridan St
- 1259 Sheridan St
- 1257 Sheridan St
- 1281 Sheridan St
- 1255 Sheridan St
- 1272 Jackson St
- 1274 Jackson St
- 1268 Jackson St
- 1276 Jackson St
- 1266 Jackson St
- 1253 Sheridan St
- 1278 Jackson St
- 1264 Jackson St
- 1262 Jackson St
- 1282 Jackson St