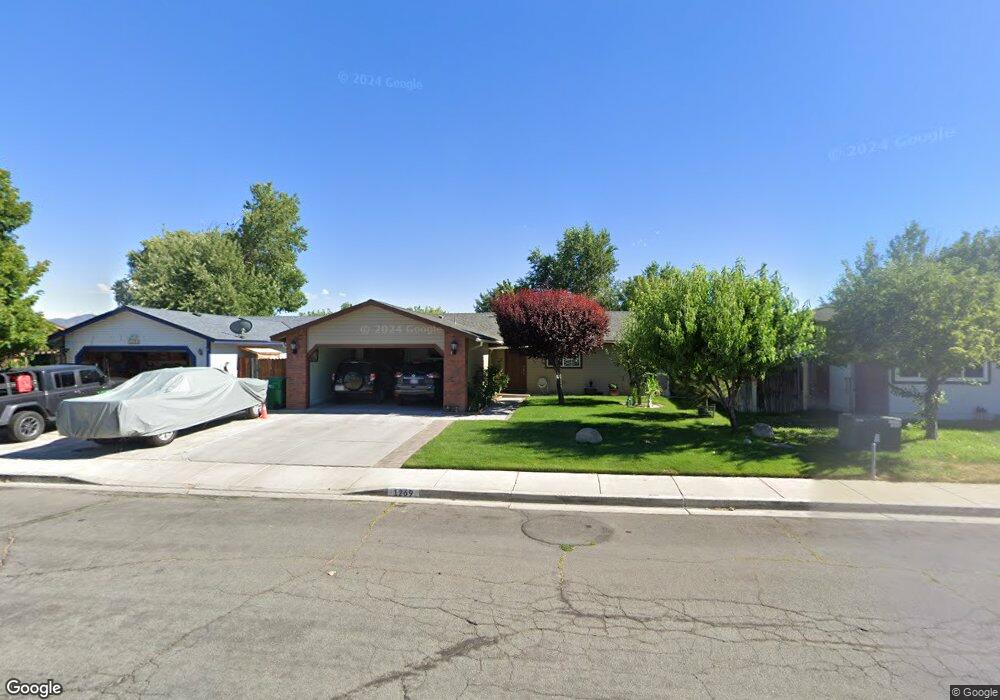
1269 Slide Mountain Dr Unit 2 Carson City, NV 89706
Northridge NeighborhoodEstimated Value: $435,000 - $438,418
4
Beds
2
Baths
1,344
Sq Ft
$325/Sq Ft
Est. Value
About This Home
This home is located at 1269 Slide Mountain Dr Unit 2, Carson City, NV 89706 and is currently estimated at $436,355, approximately $324 per square foot. 1269 Slide Mountain Dr Unit 2 is a home located in Carson City with nearby schools including Mark Twain Elementary School, Carson Middle School, and Carson High School.
Ownership History
Date
Name
Owned For
Owner Type
Purchase Details
Closed on
Jun 23, 2014
Sold by
Rodriguez Duran Sergio Albert
Bought by
Ferrer Aurora Munoz
Current Estimated Value
Home Financials for this Owner
Home Financials are based on the most recent Mortgage that was taken out on this home.
Original Mortgage
$98,188
Outstanding Balance
$75,518
Interest Rate
4.5%
Mortgage Type
FHA
Estimated Equity
$360,837
Purchase Details
Closed on
Aug 25, 2011
Sold by
Logan Wallace S
Bought by
Munoz Domingo and Munoz Veronica
Home Financials for this Owner
Home Financials are based on the most recent Mortgage that was taken out on this home.
Original Mortgage
$94,400
Interest Rate
4.43%
Mortgage Type
New Conventional
Create a Home Valuation Report for This Property
The Home Valuation Report is an in-depth analysis detailing your home's value as well as a comparison with similar homes in the area
Home Values in the Area
Average Home Value in this Area
Purchase History
| Date | Buyer | Sale Price | Title Company |
|---|---|---|---|
| Ferrer Aurora Munoz | $100,000 | Western Title Company Inc | |
| Munoz Ferrer Aurora | $100,000 | Western Title Co | |
| Munoz Domingo | $118,000 | First American Title Ins Co |
Source: Public Records
Mortgage History
| Date | Status | Borrower | Loan Amount |
|---|---|---|---|
| Open | Munoz Ferrer Aurora | $98,188 | |
| Previous Owner | Munoz Domingo | $94,400 |
Source: Public Records
Tax History Compared to Growth
Tax History
| Year | Tax Paid | Tax Assessment Tax Assessment Total Assessment is a certain percentage of the fair market value that is determined by local assessors to be the total taxable value of land and additions on the property. | Land | Improvement |
|---|---|---|---|---|
| 2025 | $2,150 | $79,348 | $33,250 | $46,098 |
| 2024 | $1,951 | $76,451 | $31,500 | $44,951 |
| 2023 | $1,807 | $71,097 | $28,700 | $42,397 |
| 2022 | $1,673 | $62,440 | $23,975 | $38,465 |
| 2021 | $1,625 | $57,868 | $19,950 | $37,918 |
| 2020 | $1,625 | $53,920 | $16,450 | $37,470 |
| 2019 | $1,530 | $53,706 | $16,450 | $37,256 |
| 2018 | $1,485 | $51,772 | $15,750 | $36,022 |
| 2017 | $1,442 | $49,435 | $13,475 | $35,960 |
| 2016 | $1,406 | $49,088 | $12,250 | $36,838 |
| 2015 | $1,403 | $47,258 | $10,390 | $36,868 |
| 2014 | $1,362 | $41,399 | $8,313 | $33,086 |
Source: Public Records
Map
Nearby Homes
- 1381 Spooner Dr
- 1331 Rolling Hills Dr
- 1968 Marian Ave
- 956 Lindsay Ln Unit 3
- 2616 Carriage Crest Dr
- 2743 Longridge Dr
- 2051 Southridge Ct
- 1359 Windridge Dr
- 2554 Pinion Pine Dr
- 2750 Carriage Crest Dr
- 493 Hot Springs Rd Unit 24
- 1529 E Long St
- 1366 Campagni Ln
- 1955 F St
- 1393 Handelin Rd
- 1902 N Peter's St
- 1610 N Stewart St
- 0 Research Way
- 1950 N Carson St Unit 40
- 2048 Poole Way
- 1291 Slide Mountain Dr
- 1247 Slide Mountain Dr
- 1270 Lindsay Ln
- 1292 Lindsay Ln
- 1313 Slide Mountain Dr
- 1225 Slide Mountain Dr
- 1268 Slide Mountain Dr
- 1314 Lindsay Ln
- 1226 Lindsay Ln
- 1246 Slide Mountain Dr
- 1290 Slide Mountain Dr
- 1335 Slide Mountain Dr Unit 2
- 2267 Marian Ave
- 1312 Slide Mountain Dr
- 1224 Slide Mountain Dr
- 1336 Lindsay Ln
- 2233 Marian Ave
- 1334 Slide Mountain Dr
- 2331 Marian Ave
- 1357 Slide Mountain Dr