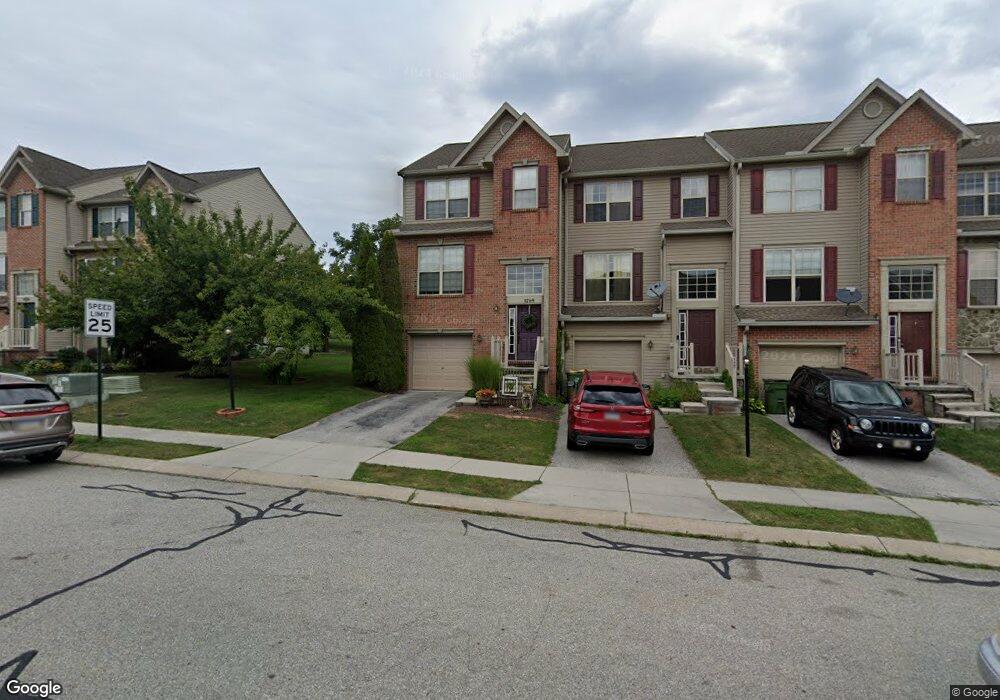
1269 Wanda Dr Hanover, PA 17331
Estimated Value: $231,000 - $270,000
3
Beds
3
Baths
1,906
Sq Ft
$133/Sq Ft
Est. Value
About This Home
This home is located at 1269 Wanda Dr, Hanover, PA 17331 and is currently estimated at $253,431, approximately $132 per square foot. 1269 Wanda Dr is a home located in York County with nearby schools including South Western Senior High School, St Joseph Catholic School, and Hope Christian School Of Hanover.
Ownership History
Date
Name
Owned For
Owner Type
Purchase Details
Closed on
Mar 22, 2021
Sold by
Staub Leo J
Bought by
Garcia Cesar and Garcia Elisa
Current Estimated Value
Home Financials for this Owner
Home Financials are based on the most recent Mortgage that was taken out on this home.
Original Mortgage
$184,140
Outstanding Balance
$165,068
Interest Rate
2.7%
Mortgage Type
VA
Estimated Equity
$88,363
Purchase Details
Closed on
Nov 21, 2007
Sold by
Noble Douglas A and Noble Carol A
Bought by
Staub Leo J and Staub Justine
Purchase Details
Closed on
Apr 21, 2005
Sold by
Myers Joseph A
Bought by
Noble Douglas A and Noble Carol A
Home Financials for this Owner
Home Financials are based on the most recent Mortgage that was taken out on this home.
Original Mortgage
$122,752
Interest Rate
6.05%
Mortgage Type
Fannie Mae Freddie Mac
Create a Home Valuation Report for This Property
The Home Valuation Report is an in-depth analysis detailing your home's value as well as a comparison with similar homes in the area
Home Values in the Area
Average Home Value in this Area
Purchase History
| Date | Buyer | Sale Price | Title Company |
|---|---|---|---|
| Garcia Cesar | -- | Black Abstract Inc | |
| Staub Leo J | $180,000 | None Available | |
| Noble Douglas A | $175,360 | -- |
Source: Public Records
Mortgage History
| Date | Status | Borrower | Loan Amount |
|---|---|---|---|
| Open | Garcia Cesar | $184,140 | |
| Previous Owner | Noble Douglas A | $122,752 |
Source: Public Records
Tax History
| Year | Tax Paid | Tax Assessment Tax Assessment Total Assessment is a certain percentage of the fair market value that is determined by local assessors to be the total taxable value of land and additions on the property. | Land | Improvement |
|---|---|---|---|---|
| 2025 | $5,662 | $169,520 | $29,680 | $139,840 |
| 2024 | $5,662 | $169,520 | $29,680 | $139,840 |
| 2023 | $5,560 | $169,520 | $29,680 | $139,840 |
| 2022 | $5,474 | $169,520 | $29,680 | $139,840 |
| 2021 | $5,225 | $169,520 | $29,680 | $139,840 |
| 2020 | $5,225 | $169,520 | $29,680 | $139,840 |
| 2018 | $5,040 | $169,520 | $29,680 | $139,840 |
| 2017 | $4,942 | $169,520 | $29,680 | $139,840 |
| 2016 | $0 | $169,520 | $29,680 | $139,840 |
| 2015 | -- | $169,520 | $29,680 | $139,840 |
| 2014 | -- | $169,520 | $29,680 | $139,840 |
Source: Public Records
Map
Nearby Homes
- 128 Zachary Dr
- 48 Colonial Dr
- 44 Colonial Dr
- 276 Ridgeview Ln Unit 46
- 260 Ridge View Ln Unit 42
- 256 Ridge View Ln Unit 41
- 244 Ridge View Ln Unit 38
- 232 Ridge View Ln Unit 35
- 224 Ridge View Ln Unit 33
- 220 Ridge View Ln Unit 32
- 212 Ridge View Ln Unit 30
- 1435 Wanda Dr
- 86 Homestead Dr
- 225 Bragg Cir
- 151 Homestead Dr
- 202 Homestead Dr
- 96 Ayrshire Dr
- 56 Cardinal Dr
- 437 Valley View Dr
- 84 Lakeview Cir
Your Personal Tour Guide
Ask me questions while you tour the home.