Estimated Value: $397,000 - $464,000
3
Beds
2
Baths
1,204
Sq Ft
$362/Sq Ft
Est. Value
About This Home
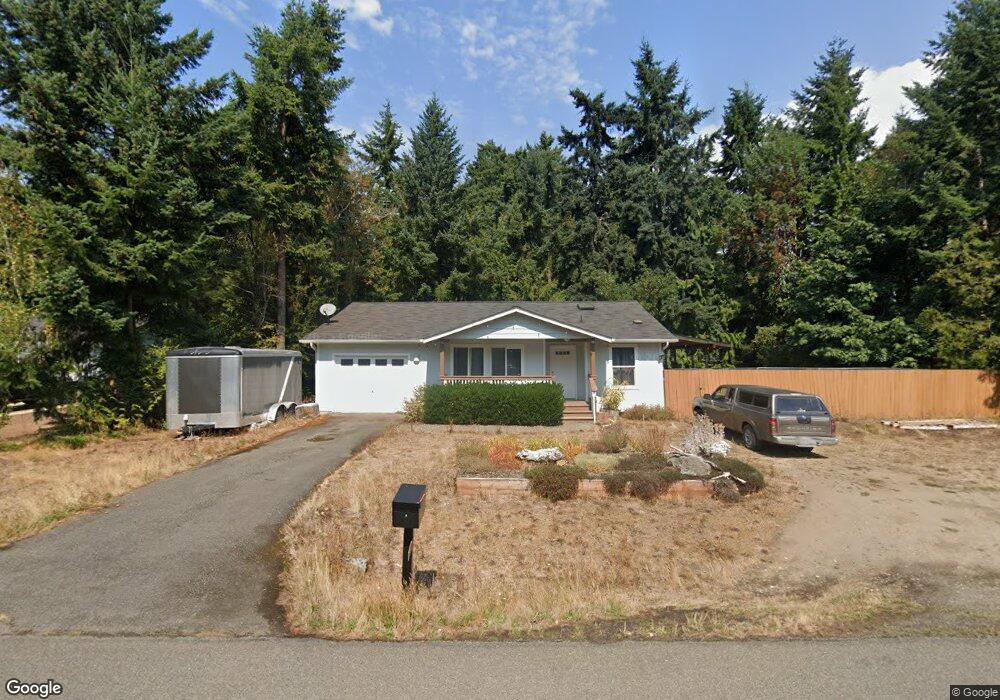
This home is located at 127 1st St, Port Hadlock, WA 98339 and is currently estimated at $435,381, approximately $361 per square foot. 127 1st St is a home located in Jefferson County with nearby schools including Chimacum Creek Primary School, Chimacum School Pi Program, and Chimacum Elementary School.
Ownership History
Date
Name
Owned For
Owner Type
Purchase Details
Closed on
Oct 6, 2017
Sold by
Bacchus Justin L
Bought by
Linner Denae Nicole
Current Estimated Value
Home Financials for this Owner
Home Financials are based on the most recent Mortgage that was taken out on this home.
Original Mortgage
$231,750
Outstanding Balance
$199,197
Interest Rate
3.82%
Mortgage Type
USDA
Estimated Equity
$236,184
Purchase Details
Closed on
Mar 28, 2011
Sold by
Gazay Kevin B
Bought by
Bacchus Justin L
Home Financials for this Owner
Home Financials are based on the most recent Mortgage that was taken out on this home.
Original Mortgage
$163,478
Interest Rate
4.83%
Mortgage Type
New Conventional
Purchase Details
Closed on
Aug 4, 2006
Sold by
T D Escrow Services Inc
Bought by
Gazay Kevin B
Create a Home Valuation Report for This Property
The Home Valuation Report is an in-depth analysis detailing your home's value as well as a comparison with similar homes in the area
Home Values in the Area
Average Home Value in this Area
Purchase History
| Date | Buyer | Sale Price | Title Company |
|---|---|---|---|
| Linner Denae Nicole | $231,750 | Jefferson Title Co Inc | |
| Bacchus Justin L | $157,950 | None Available | |
| Gazay Kevin B | -- | None Available |
Source: Public Records
Mortgage History
| Date | Status | Borrower | Loan Amount |
|---|---|---|---|
| Open | Linner Denae Nicole | $231,750 | |
| Previous Owner | Bacchus Justin L | $163,478 |
Source: Public Records
Tax History Compared to Growth
Tax History
| Year | Tax Paid | Tax Assessment Tax Assessment Total Assessment is a certain percentage of the fair market value that is determined by local assessors to be the total taxable value of land and additions on the property. | Land | Improvement |
|---|---|---|---|---|
| 2024 | $2,604 | $344,442 | $99,750 | $244,692 |
| 2023 | $2,604 | $323,569 | $90,000 | $233,569 |
| 2022 | $2,253 | $273,251 | $85,000 | $188,251 |
| 2021 | $2,222 | $248,407 | $74,100 | $174,307 |
| 2020 | $2,050 | $230,257 | $68,400 | $161,857 |
| 2019 | $1,860 | $205,881 | $62,700 | $143,181 |
| 2018 | $2,042 | $187,730 | $57,000 | $130,730 |
| 2017 | $1,709 | $181,505 | $57,000 | $124,505 |
| 2016 | $1,701 | $161,522 | $52,800 | $108,722 |
| 2015 | $1,675 | $161,522 | $52,800 | $108,722 |
| 2014 | -- | $161,522 | $52,800 | $108,722 |
| 2013 | -- | $146,840 | $48,000 | $98,840 |
Source: Public Records
Map
Nearby Homes
- 31 2nd St
- 611 Cedar Ave Unit 51
- 611 Cedar Ave Unit 33
- 611 Cedar Ave Unit 62
- 0 NKA C St
- 1210 Irondale Rd
- 0 901024068 Unit NWM2387187
- 0 901024068 Unit Port Hadlock WA 9833
- 31 Petes Spur
- 153 Sunset Meadows Ln
- 177 Sunset Meadows Ln
- 781 Irondale Rd
- 51 Thomas Dr
- 371 E Price St
- 0 E Eugene St
- 2 Lylus Ln
- 1 Lylus Ln
- 999 Ann Kivley Dr
- 52 E Moore St
- 10955 NKA Rhody Dr