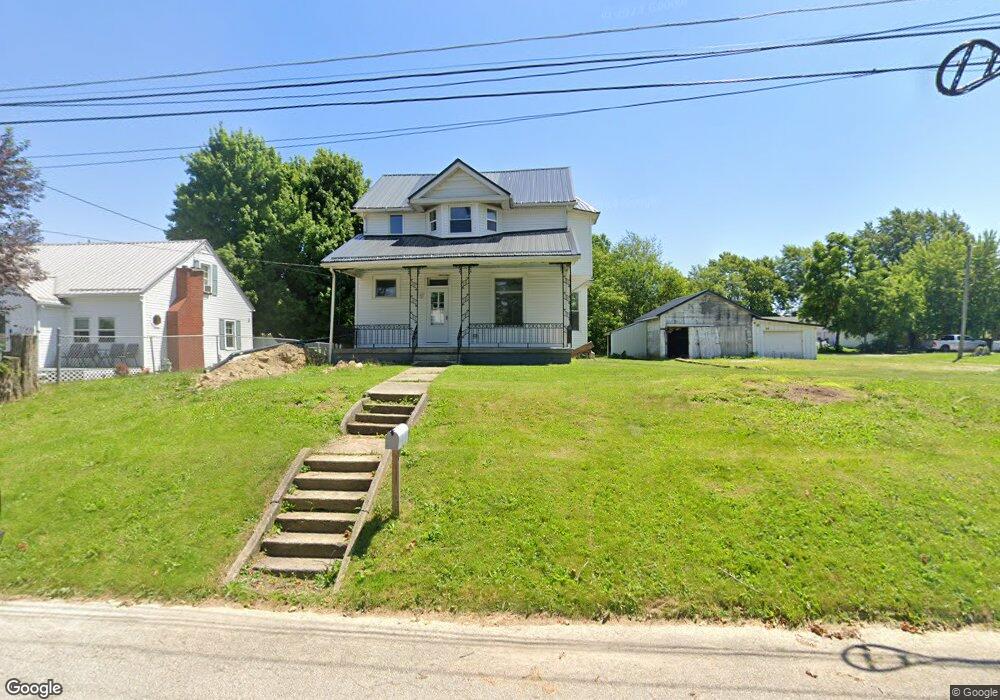
127 2nd St Shelby, OH 44875
Estimated Value: $131,000 - $145,154
4
Beds
1
Bath
1,001
Sq Ft
$139/Sq Ft
Est. Value
About This Home
This home is located at 127 2nd St, Shelby, OH 44875 and is currently estimated at $139,289, approximately $139 per square foot. 127 2nd St is a home located in Richland County with nearby schools including St. Mary's School.
Ownership History
Date
Name
Owned For
Owner Type
Purchase Details
Closed on
Mar 15, 2017
Sold by
Baldridge Clellie W
Bought by
Stephens Virgil
Current Estimated Value
Purchase Details
Closed on
Apr 4, 2014
Sold by
Baldridge Steve L and Baldridge Mary
Bought by
Baldridge Clellie W
Purchase Details
Closed on
Apr 2, 2014
Sold by
Eicholtz Mary
Bought by
Baldridge Clellie W
Purchase Details
Closed on
Sep 7, 1999
Sold by
Couch Ben
Bought by
Baldridge Clellie W and Baldridge Cheryl L
Purchase Details
Closed on
Aug 13, 1991
Bought by
Couch Ben
Create a Home Valuation Report for This Property
The Home Valuation Report is an in-depth analysis detailing your home's value as well as a comparison with similar homes in the area
Home Values in the Area
Average Home Value in this Area
Purchase History
| Date | Buyer | Sale Price | Title Company |
|---|---|---|---|
| Stephens Virgil | $6,500 | Chicago Title Agency North | |
| Baldridge Clellie W | -- | None Available | |
| Baldridge Clellie W | -- | None Available | |
| Baldridge Clellie W | $5,000 | -- | |
| Couch Ben | -- | -- |
Source: Public Records
Tax History Compared to Growth
Tax History
| Year | Tax Paid | Tax Assessment Tax Assessment Total Assessment is a certain percentage of the fair market value that is determined by local assessors to be the total taxable value of land and additions on the property. | Land | Improvement |
|---|---|---|---|---|
| 2024 | $1,405 | $35,870 | $5,640 | $30,230 |
| 2023 | $1,405 | $35,870 | $5,640 | $30,230 |
| 2022 | $1,402 | $32,010 | $5,870 | $26,140 |
| 2021 | $1,402 | $32,010 | $5,870 | $26,140 |
| 2020 | $1,369 | $32,010 | $5,870 | $26,140 |
| 2019 | $1,260 | $27,030 | $4,930 | $22,100 |
| 2018 | $1,240 | $26,860 | $4,760 | $22,100 |
| 2017 | $988 | $26,860 | $4,760 | $22,100 |
| 2016 | $903 | $19,880 | $5,650 | $14,230 |
| 2015 | $898 | $19,880 | $5,650 | $14,230 |
| 2014 | $868 | $19,880 | $5,650 | $14,230 |
| 2012 | $230 | $19,890 | $5,950 | $13,940 |
Source: Public Records
Map
Nearby Homes