127 Ardennes Dr Unit 3 Eatonton, GA 31024
Estimated Value: $1,023,404 - $1,224,000
4
Beds
3
Baths
2,484
Sq Ft
$454/Sq Ft
Est. Value
About This Home
This home is located at 127 Ardennes Dr Unit 3, Eatonton, GA 31024 and is currently estimated at $1,126,851, approximately $453 per square foot. 127 Ardennes Dr Unit 3 is a home located in Putnam County with nearby schools including Putnam County Primary School, Putnam County Elementary School, and Putnam County Middle School.
Ownership History
Date
Name
Owned For
Owner Type
Purchase Details
Closed on
Aug 20, 2013
Sold by
Bryant John T
Bought by
Dockery John James Robert and Dockery Agness Patricia Belger
Current Estimated Value
Home Financials for this Owner
Home Financials are based on the most recent Mortgage that was taken out on this home.
Original Mortgage
$225,000
Outstanding Balance
$112,554
Interest Rate
4.31%
Mortgage Type
New Conventional
Estimated Equity
$1,014,297
Purchase Details
Closed on
Mar 18, 1998
Sold by
Logan James F and Logan Fran
Bought by
Bryant John T Glenda
Purchase Details
Closed on
Mar 18, 1993
Sold by
Logan James F
Bought by
Logan James F and Logan Fran
Purchase Details
Closed on
Oct 24, 1985
Sold by
Lawrence George D
Bought by
Logan James F
Purchase Details
Closed on
Mar 26, 1985
Sold by
Sanders Karl D Etal
Bought by
Lawrence George D
Create a Home Valuation Report for This Property
The Home Valuation Report is an in-depth analysis detailing your home's value as well as a comparison with similar homes in the area
Home Values in the Area
Average Home Value in this Area
Purchase History
| Date | Buyer | Sale Price | Title Company |
|---|---|---|---|
| Dockery John James Robert | $480,000 | -- | |
| Bryant John T Glenda | $175,000 | -- | |
| Logan James F | -- | -- | |
| Logan James F | $25,000 | -- | |
| Lawrence George D | $18,000 | -- |
Source: Public Records
Mortgage History
| Date | Status | Borrower | Loan Amount |
|---|---|---|---|
| Open | Dockery John James Robert | $225,000 |
Source: Public Records
Tax History Compared to Growth
Tax History
| Year | Tax Paid | Tax Assessment Tax Assessment Total Assessment is a certain percentage of the fair market value that is determined by local assessors to be the total taxable value of land and additions on the property. | Land | Improvement |
|---|---|---|---|---|
| 2024 | $6,289 | $365,100 | $192,000 | $173,100 |
| 2023 | $6,289 | $381,654 | $192,000 | $189,654 |
| 2022 | $5,855 | $291,616 | $168,000 | $123,616 |
| 2021 | $4,748 | $208,394 | $120,000 | $88,394 |
| 2020 | $4,796 | $197,968 | $112,500 | $85,468 |
| 2019 | $4,849 | $197,142 | $112,500 | $84,642 |
| 2018 | $4,778 | $191,257 | $112,500 | $78,757 |
| 2017 | $4,180 | $185,399 | $112,500 | $72,899 |
| 2016 | $3,812 | $168,899 | $96,000 | $72,899 |
| 2015 | $3,674 | $168,899 | $96,000 | $72,899 |
| 2014 | $3,679 | $168,899 | $96,000 | $72,899 |
Source: Public Records
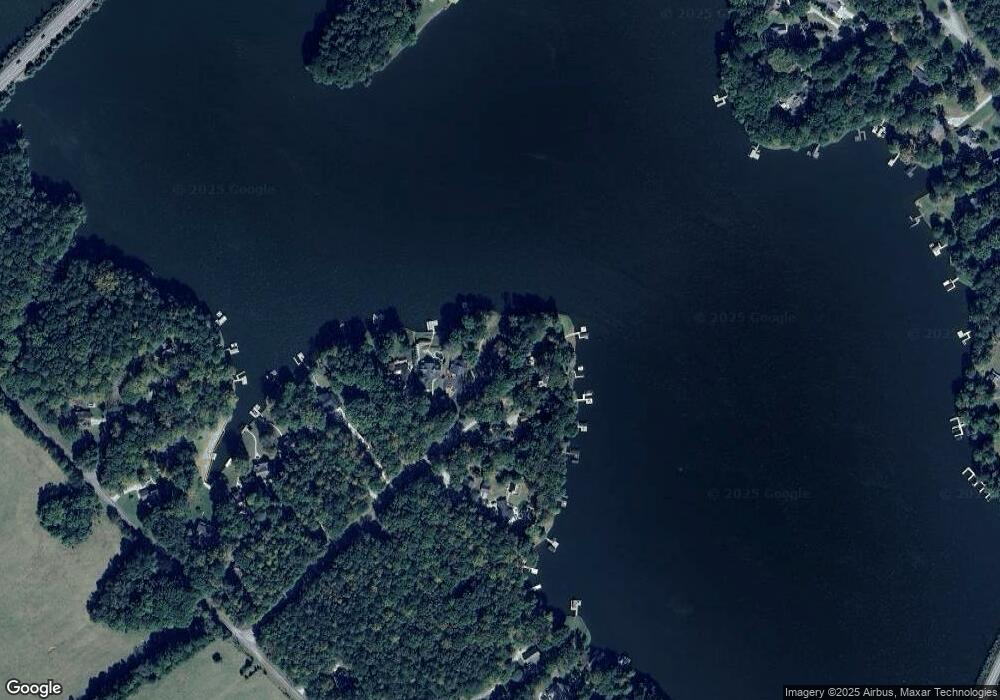
Map
Nearby Homes
- 146 Misty Ln
- 136 N Hidden Lake Dr
- 224 Loch Way
- 118 Lake Forest Dr
- 930 Lake Oconee Pkwy Unit 322
- 930 Lake Oconee Pkwy
- 930 Lake Oconee Pkwy Unit 320
- 135 Phoenix Dr
- 905 (Unit 208) Greensboro Rd
- 905 Greensboro Rd
- 905 Greensboro Rd Unit 106
- 115 Lullwater Ln
- Lot 9 Covey Dr
- Lot 8 Covey Dr
- Lot 7 Covey Dr
- Lot 3 Echo Ln
- Lot 2 Echo Ln
- Lot 1 Echo Ln
- 114 Mags Path
- 112 Chapel Springs Dr
- 127 Ardennes Dr
- 125 Ardennes Dr
- 129 Ardennes Dr
- 128 Ardennes Dr
- 126 Ardennes Dr
- 123 Ardennes Dr Unit 8
- 123 Ardennes Dr
- 124 Ardennes Dr
- 122 Ardennes Dr
- 122A Ardennes Dr
- 121 Ardennes Dr
- 117 Ardennes Dr
- 120 Ardennes Dr
- 118 Ardennes Dr
- 115 Ardennes Dr
- Lot 16 Ardennes Dr
- 113 Ardennes Dr
- 113 Ardennes Dr Unit 5-1
- 111 Ardennes Dr
- 114 Ardennes Dr