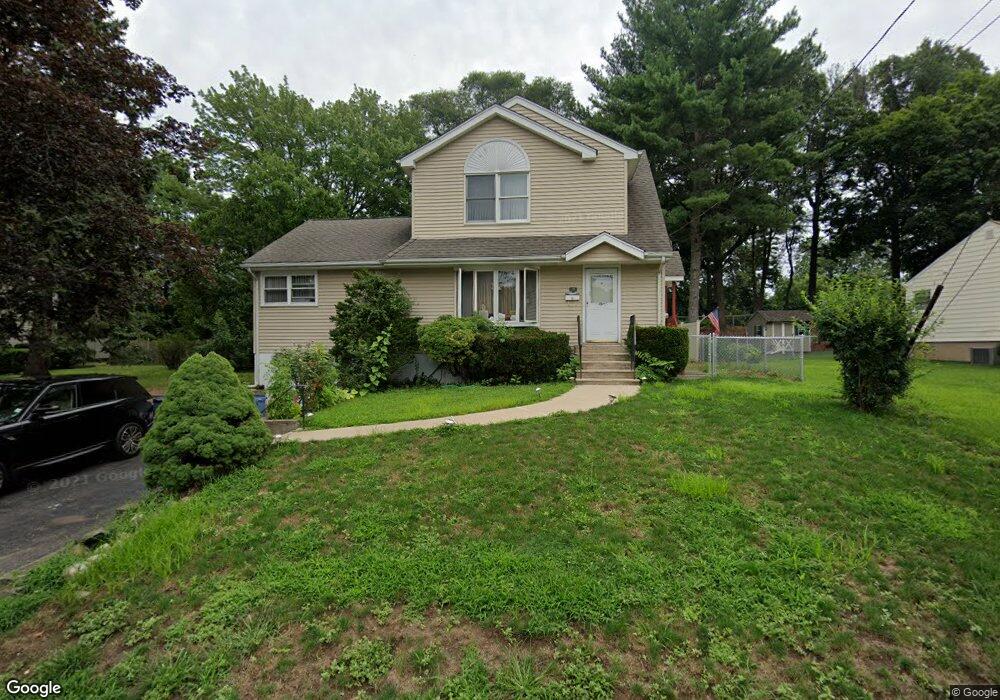
127 Bedford Rd Dumont, NJ 07628
Estimated Value: $647,705 - $707,000
--
Bed
--
Bath
1,445
Sq Ft
$471/Sq Ft
Est. Value
About This Home
This home is located at 127 Bedford Rd, Dumont, NJ 07628 and is currently estimated at $680,426, approximately $470 per square foot. 127 Bedford Rd is a home located in Bergen County with nearby schools including Dumont High School and Institute For Educational Achievement.
Ownership History
Date
Name
Owned For
Owner Type
Purchase Details
Closed on
Mar 29, 2007
Sold by
Gerbasi Christine
Bought by
Vincent Tessa
Current Estimated Value
Home Financials for this Owner
Home Financials are based on the most recent Mortgage that was taken out on this home.
Original Mortgage
$63,000
Outstanding Balance
$38,280
Interest Rate
6.24%
Estimated Equity
$642,146
Purchase Details
Closed on
May 22, 1997
Sold by
Thomsen Hans and Thomsen Irmgard
Bought by
Gerbasi Christine
Home Financials for this Owner
Home Financials are based on the most recent Mortgage that was taken out on this home.
Original Mortgage
$75,000
Interest Rate
8.08%
Create a Home Valuation Report for This Property
The Home Valuation Report is an in-depth analysis detailing your home's value as well as a comparison with similar homes in the area
Home Values in the Area
Average Home Value in this Area
Purchase History
| Date | Buyer | Sale Price | Title Company |
|---|---|---|---|
| Vincent Tessa | $420,000 | -- | |
| Gerbasi Christine | $163,500 | -- |
Source: Public Records
Mortgage History
| Date | Status | Borrower | Loan Amount |
|---|---|---|---|
| Open | Vincent Tessa | $63,000 | |
| Previous Owner | Gerbasi Christine | $75,000 |
Source: Public Records
Tax History Compared to Growth
Tax History
| Year | Tax Paid | Tax Assessment Tax Assessment Total Assessment is a certain percentage of the fair market value that is determined by local assessors to be the total taxable value of land and additions on the property. | Land | Improvement |
|---|---|---|---|---|
| 2025 | $12,602 | $591,100 | $306,600 | $284,500 |
| 2024 | $12,292 | $310,000 | $179,400 | $130,600 |
| 2023 | $12,037 | $310,000 | $179,400 | $130,600 |
| 2022 | $12,037 | $310,000 | $179,400 | $130,600 |
| 2021 | $11,978 | $310,000 | $179,400 | $130,600 |
| 2020 | $11,653 | $310,000 | $179,400 | $130,600 |
| 2019 | $11,374 | $310,000 | $179,400 | $130,600 |
| 2018 | $11,141 | $310,000 | $179,400 | $130,600 |
| 2017 | $10,928 | $310,000 | $179,400 | $130,600 |
| 2016 | $10,673 | $310,000 | $179,400 | $130,600 |
| 2015 | $11,014 | $327,400 | $179,400 | $148,000 |
| 2014 | $10,798 | $327,400 | $179,400 | $148,000 |
Source: Public Records
Map
Nearby Homes