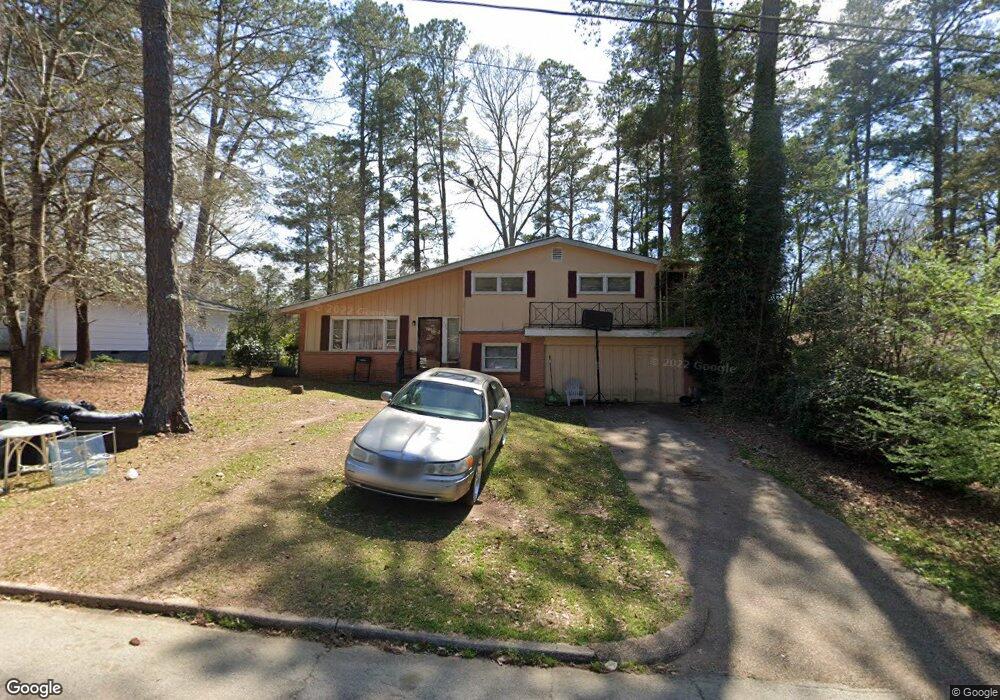
127 Bonaventure Dr Lagrange, GA 30241
Estimated Value: $154,000 - $194,000
3
Beds
2
Baths
1,083
Sq Ft
$157/Sq Ft
Est. Value
About This Home
This home is located at 127 Bonaventure Dr, Lagrange, GA 30241 and is currently estimated at $169,959, approximately $156 per square foot. 127 Bonaventure Dr is a home located in Troup County with nearby schools including Franklin Forest Elementary School, Hollis Hand Elementary School, and Ethel W. Kight Elementary School.
Ownership History
Date
Name
Owned For
Owner Type
Purchase Details
Closed on
Nov 27, 2007
Sold by
Wilson Jeff
Bought by
Winslow John M and Winslow Ann Marie
Current Estimated Value
Purchase Details
Closed on
Oct 20, 2004
Sold by
Jeff Wilson Interest
Bought by
Brad Jeff and Brad Wilson
Purchase Details
Closed on
Oct 19, 2004
Sold by
Secretary Of Hud
Bought by
Jeff Wilson Interest
Purchase Details
Closed on
Jul 7, 2004
Sold by
Everhome Mortgage Co
Bought by
Secretary Of Hud
Purchase Details
Closed on
Jul 6, 2004
Sold by
Dennis J Royster
Bought by
Everhome Mortgage Co
Purchase Details
Closed on
Jul 12, 2001
Sold by
James S Mcguffin
Bought by
Dennis J Royster
Purchase Details
Closed on
Sep 13, 1999
Sold by
Bowles Jessie
Bought by
James S Mcguffin
Purchase Details
Closed on
Sep 1, 1999
Sold by
Phillip Ii E Stribling
Bought by
Bowles Jessie
Purchase Details
Closed on
May 1, 1964
Sold by
Duffey Wesley Claude
Bought by
Phillip Ii E Stribling
Create a Home Valuation Report for This Property
The Home Valuation Report is an in-depth analysis detailing your home's value as well as a comparison with similar homes in the area
Home Values in the Area
Average Home Value in this Area
Purchase History
| Date | Buyer | Sale Price | Title Company |
|---|---|---|---|
| Winslow John M | $59,000 | -- | |
| Brad Jeff | -- | -- | |
| Jeff Wilson Interest | -- | -- | |
| Secretary Of Hud | $77,900 | -- | |
| Everhome Mortgage Co | $77,900 | -- | |
| Dennis J Royster | $67,900 | -- | |
| James S Mcguffin | $44,000 | -- | |
| Bowles Jessie | $68,500 | -- | |
| Phillip Ii E Stribling | -- | -- |
Source: Public Records
Tax History Compared to Growth
Tax History
| Year | Tax Paid | Tax Assessment Tax Assessment Total Assessment is a certain percentage of the fair market value that is determined by local assessors to be the total taxable value of land and additions on the property. | Land | Improvement |
|---|---|---|---|---|
| 2024 | $1,457 | $53,420 | $8,000 | $45,420 |
| 2023 | $1,451 | $1,200 | $0 | $1,200 |
| 2022 | $881 | $37,128 | $7,400 | $29,728 |
| 2021 | $978 | $32,432 | $7,400 | $25,032 |
| 2020 | $978 | $32,432 | $7,400 | $25,032 |
| 2019 | $845 | $28,012 | $6,300 | $21,712 |
| 2018 | $845 | $28,012 | $6,300 | $21,712 |
| 2017 | $845 | $28,012 | $6,300 | $21,712 |
| 2016 | $822 | $27,250 | $6,300 | $20,950 |
| 2015 | $816 | $27,002 | $6,678 | $20,324 |
| 2014 | $785 | $25,932 | $6,678 | $19,254 |
| 2013 | -- | $27,016 | $6,678 | $20,338 |
Source: Public Records
Map
Nearby Homes
- 210 Hearthstone Dr
- 121 Ct
- 130 Clara Jean Ct
- 305 Lenox Cir
- 105 Lenox Cir
- 101 Lenox Cir
- 226 Lenox Cir
- 0 N Barnard Ave
- 618 S Harlem Cir
- 616 S Harlem Cir
- 706 N Harlem Cir
- 608 S Harlem Cir
- 5 Curran Ave
- 606 S Harlem Cir
- 600 S Harlem Cir
- 131 Foch St
- 109 Dogwood Dr
- 227 River Meadow Dr Unit H14
- 231 River Meadow Dr
- 219 River Meadow Dr
- 125 Bonaventure Dr
- 129 Bonaventure Dr
- 123 Bonaventure Dr
- 239 Rutland Cir
- 237 Rutland Cir
- 241 Rutland Cir
- 235 Rutland Cir
- 121 Bonaventure Dr
- 243 Rutland Cir
- 130 Bonaventure Dr
- 126 Bonaventure Dr
- 139 Bonaventure Dr
- 245 Rutland Cir
- 141 Bonaventure Dr
- 132 Bonaventure Dr
- 124 Bonaventure Dr
- 119 Bonaventure Dr
- 134 Bonaventure Dr
- 143 Bonaventure Dr
- 122 Bonaventure Dr