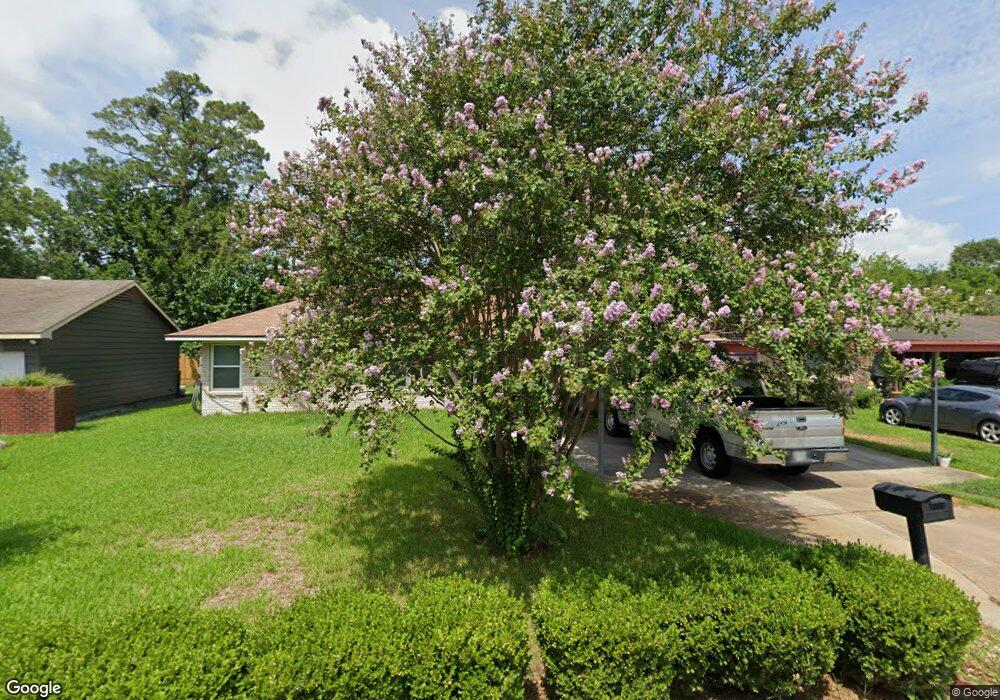
127 Carlang St Channelview, TX 77530
Estimated Value: $136,310 - $249,000
3
Beds
1
Bath
1,360
Sq Ft
$145/Sq Ft
Est. Value
About This Home
This home is located at 127 Carlang St, Channelview, TX 77530 and is currently estimated at $196,770, approximately $144 per square foot. 127 Carlang St is a home located in Harris County with nearby schools including Channelview High School and Family Christian Academy.
Ownership History
Date
Name
Owned For
Owner Type
Purchase Details
Closed on
Apr 14, 2021
Sold by
Richardson William G
Bought by
Ledesma Justin Anthony and Franco Daisy Yvonne
Current Estimated Value
Home Financials for this Owner
Home Financials are based on the most recent Mortgage that was taken out on this home.
Original Mortgage
$120,000
Outstanding Balance
$108,345
Interest Rate
3%
Mortgage Type
VA
Estimated Equity
$88,425
Create a Home Valuation Report for This Property
The Home Valuation Report is an in-depth analysis detailing your home's value as well as a comparison with similar homes in the area
Home Values in the Area
Average Home Value in this Area
Purchase History
| Date | Buyer | Sale Price | Title Company |
|---|---|---|---|
| Ledesma Justin Anthony | -- | South Land Title Company |
Source: Public Records
Mortgage History
| Date | Status | Borrower | Loan Amount |
|---|---|---|---|
| Open | Ledesma Justin Anthony | $120,000 |
Source: Public Records
Tax History Compared to Growth
Tax History
| Year | Tax Paid | Tax Assessment Tax Assessment Total Assessment is a certain percentage of the fair market value that is determined by local assessors to be the total taxable value of land and additions on the property. | Land | Improvement |
|---|---|---|---|---|
| 2025 | $513 | $78,629 | $32,670 | $45,959 |
| 2024 | $513 | $59,174 | $13,068 | $46,106 |
| 2023 | $513 | $59,174 | $13,068 | $46,106 |
| 2022 | $1,377 | $59,174 | $13,068 | $46,106 |
| 2021 | $1,120 | $46,222 | $9,801 | $36,421 |
| 2020 | $1,187 | $46,222 | $9,801 | $36,421 |
| 2019 | $1,214 | $46,222 | $9,801 | $36,421 |
| 2018 | $0 | $46,222 | $9,801 | $36,421 |
| 2017 | $1,096 | $46,222 | $9,801 | $36,421 |
| 2016 | $996 | $37,881 | $4,574 | $33,307 |
| 2015 | $11 | $37,881 | $4,574 | $33,307 |
| 2014 | $11 | $37,881 | $4,574 | $33,307 |
Source: Public Records
Map
Nearby Homes
- 523 Sheldon Rd
- 431 Crockett St
- 15603 N Brentwood St
- 702 Norell St
- 15506 Vonnett St
- 714 Horncastle St
- 812 Coolidge St
- 818 Mccardell St
- 822 Woodhue St
- 16305 De Zavalla Rd
- 815 Spates St
- 814 Kilpatrick St
- 743 Knob Hollow St
- 803 Knob Hollow St
- 722 Canna St
- 16032 1/2 Ridlon St
- 16023 Ridlon St
- 714 Ivy Hollow St
- 16516 Market St
- 15225 Woodforest Blvd
- 121 Carlang St
- 133 Carlang St
- 201 Carlang St
- 109 Carlang St
- 126 Carlang St
- 132 Carlang St
- 207 Carlang St
- 120 Carlang St
- 202 Carlang St
- 15639 Market St
- 208 Carlang St
- 215 Carlang St
- 108 Carlang St
- 214 Carlang St
- 15703 Market St
- 220 Carlang St
- 225 Carlang St
- 226 Carlang St
- 15627 Market St
- 15631 Market St