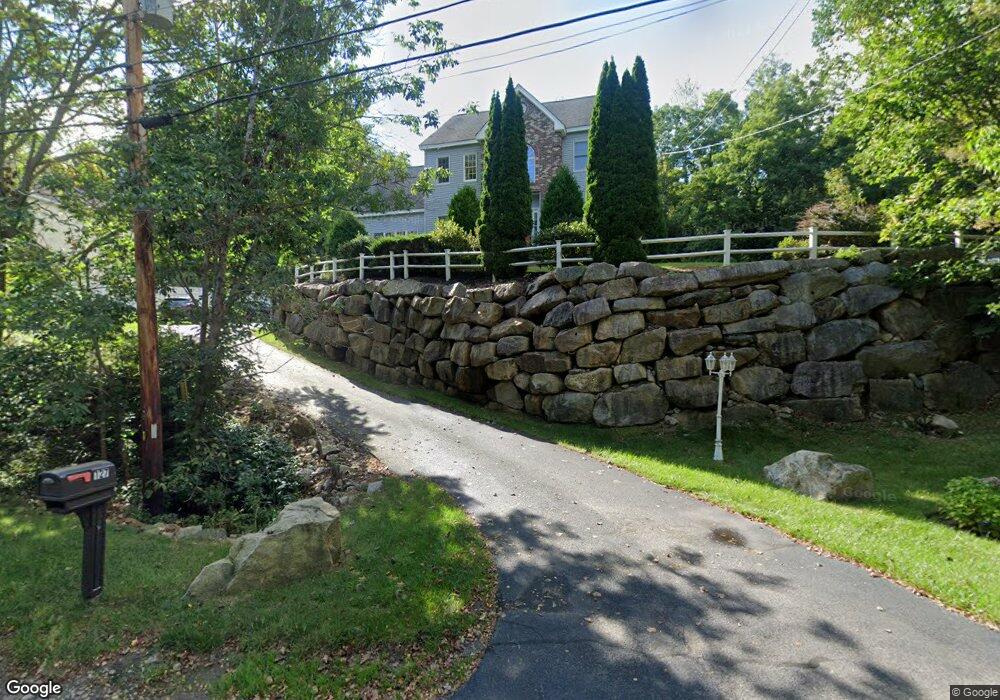
127 Cedar St Ashland, MA 01721
Estimated Value: $911,675 - $1,025,000
4
Beds
3
Baths
2,540
Sq Ft
$376/Sq Ft
Est. Value
About This Home
This home is located at 127 Cedar St, Ashland, MA 01721 and is currently estimated at $954,919, approximately $375 per square foot. 127 Cedar St is a home located in Middlesex County with nearby schools including William Pittaway Elementary School, Henry E. Warren Elementary School, and David Mindess Elementary School.
Ownership History
Date
Name
Owned For
Owner Type
Purchase Details
Closed on
Oct 1, 1999
Sold by
Fafard Re & Dev Corp
Bought by
Moghni Ahmad and Moghni Afshan
Current Estimated Value
Home Financials for this Owner
Home Financials are based on the most recent Mortgage that was taken out on this home.
Original Mortgage
$297,441
Outstanding Balance
$89,947
Interest Rate
7.85%
Mortgage Type
Purchase Money Mortgage
Estimated Equity
$864,972
Create a Home Valuation Report for This Property
The Home Valuation Report is an in-depth analysis detailing your home's value as well as a comparison with similar homes in the area
Home Values in the Area
Average Home Value in this Area
Purchase History
| Date | Buyer | Sale Price | Title Company |
|---|---|---|---|
| Moghni Ahmad | $331,930 | -- |
Source: Public Records
Mortgage History
| Date | Status | Borrower | Loan Amount |
|---|---|---|---|
| Open | Moghni Ahmad | $297,441 |
Source: Public Records
Tax History Compared to Growth
Tax History
| Year | Tax Paid | Tax Assessment Tax Assessment Total Assessment is a certain percentage of the fair market value that is determined by local assessors to be the total taxable value of land and additions on the property. | Land | Improvement |
|---|---|---|---|---|
| 2025 | $10,844 | $849,200 | $238,200 | $611,000 |
| 2024 | $10,502 | $793,200 | $238,200 | $555,000 |
| 2023 | $9,551 | $693,600 | $226,800 | $466,800 |
| 2022 | $9,646 | $607,400 | $206,100 | $401,300 |
| 2021 | $9,203 | $577,700 | $206,100 | $371,600 |
| 2020 | $9,008 | $557,400 | $206,100 | $351,300 |
| 2019 | $8,812 | $541,300 | $206,100 | $335,200 |
| 2018 | $11,238 | $530,600 | $228,000 | $302,600 |
| 2017 | $8,734 | $523,000 | $228,000 | $295,000 |
| 2016 | $8,560 | $503,500 | $195,000 | $308,500 |
| 2015 | $8,562 | $494,900 | $182,100 | $312,800 |
| 2014 | $8,285 | $476,400 | $162,600 | $313,800 |
Source: Public Records
Map
Nearby Homes
- 262 Captain Eames Cir
- 343 Captain Eames Cir Unit 38-C
- 291 Captain Eames Cir
- 379 Captain Eames Cir
- 102 Captain Eames Cir
- 24 Old Connecticut Path
- 158 Algonquin Trail
- 76 Algonquin Trail
- 20 Mulhall Dr
- 37 James Rd
- 8 Cedar St
- 17 Stagecoach Dr
- 181 E Union St
- 10 Prospect St
- 17 Sewell St
- 638 Main St
- 6 New Castle Rd
- 8 Roberts Rd
- 69 Whitney Ave
- 6 B Harmony Ln Unit 2