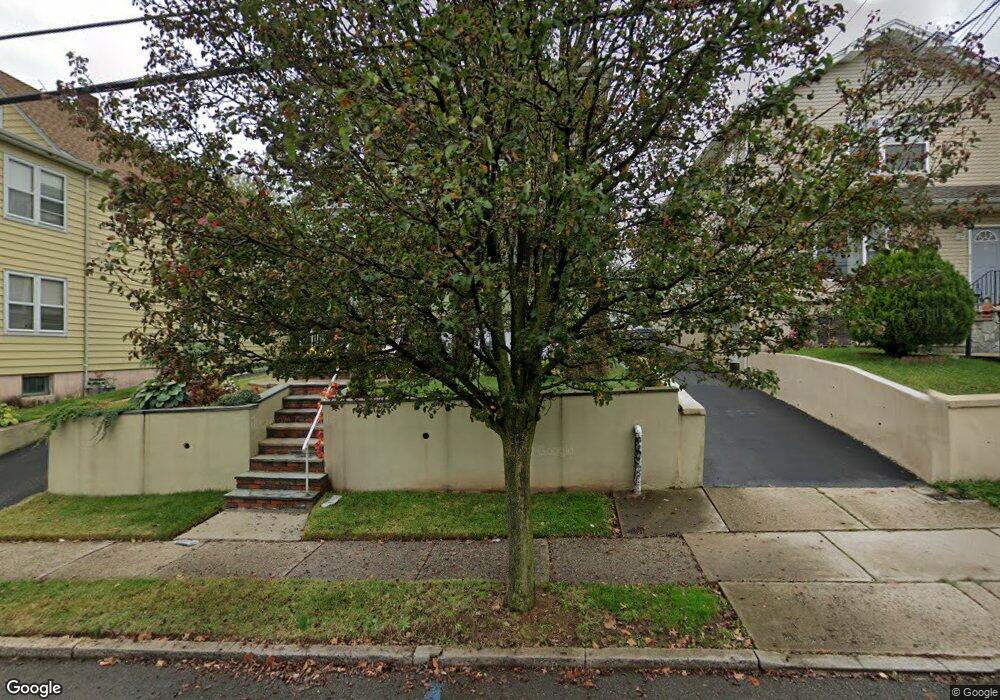
127 Cedar St Garfield, NJ 07026
Estimated Value: $597,599 - $722,000
Studio
--
Bath
1,800
Sq Ft
$377/Sq Ft
Est. Value
About This Home
This home is located at 127 Cedar St, Garfield, NJ 07026 and is currently estimated at $677,900, approximately $376 per square foot. 127 Cedar St is a home located in Bergen County with nearby schools including Garfield High School, Bergen Arts and Sciences Charter School, and Passaic Catholic Regional School.
Ownership History
Date
Name
Owned For
Owner Type
Purchase Details
Closed on
Oct 25, 2011
Sold by
Kovarckik Alice S and Kovarcik Joseph
Bought by
Reilly Edward J
Current Estimated Value
Home Financials for this Owner
Home Financials are based on the most recent Mortgage that was taken out on this home.
Original Mortgage
$344,051
Outstanding Balance
$236,347
Interest Rate
4.25%
Mortgage Type
FHA
Estimated Equity
$441,553
Purchase Details
Closed on
Aug 1, 1999
Sold by
Kovarcik Alice S
Bought by
Kovarcik Alice S and Kovarcik Joseph
Create a Home Valuation Report for This Property
The Home Valuation Report is an in-depth analysis detailing your home's value as well as a comparison with similar homes in the area
Home Values in the Area
Average Home Value in this Area
Purchase History
| Date | Buyer | Sale Price | Title Company |
|---|---|---|---|
| Reilly Edward J | $353,000 | -- | |
| Kovarcik Alice S | -- | -- |
Source: Public Records
Mortgage History
| Date | Status | Borrower | Loan Amount |
|---|---|---|---|
| Open | Reilly Edward J | $344,051 |
Source: Public Records
Tax History
| Year | Tax Paid | Tax Assessment Tax Assessment Total Assessment is a certain percentage of the fair market value that is determined by local assessors to be the total taxable value of land and additions on the property. | Land | Improvement |
|---|---|---|---|---|
| 2025 | $9,624 | $288,400 | $136,300 | $152,100 |
| 2024 | $9,462 | $288,400 | $136,300 | $152,100 |
| 2023 | $8,995 | $288,400 | $136,300 | $152,100 |
| 2022 | $8,995 | $288,400 | $136,300 | $152,100 |
| 2021 | $8,733 | $288,400 | $136,300 | $152,100 |
| 2020 | $8,542 | $288,400 | $136,300 | $152,100 |
| 2019 | $8,381 | $288,400 | $136,300 | $152,100 |
| 2018 | $8,193 | $288,400 | $136,300 | $152,100 |
| 2017 | $8,049 | $288,400 | $136,300 | $152,100 |
| 2016 | $7,810 | $288,400 | $136,300 | $152,100 |
| 2015 | $7,617 | $288,400 | $136,300 | $152,100 |
| 2014 | $7,415 | $288,400 | $136,300 | $152,100 |
Source: Public Records
Map
Nearby Homes
- 122 Cedar St
- 123 Chestnut St
- 107 Summit Ave
- 104 Belmont Ave
- 167 Orchard St
- 158 Pierre Ave
- 70 Orchard St
- 60 Dewitt St Unit A
- 72 Van Winkle Ave
- 229 Palisade Ave
- 270 Midland Ave
- 191 Cambridge Ave
- 19 Plauderville Ave Unit 110
- 93 Prospect St Unit 6
- 93 Prospect St Unit 4
- 83 Plauderville Ave
- 89 Plauderville Ave Unit 10
- 44 Malcolm Ave
- 39 Grand St
- 42 Grand St
Your Personal Tour Guide
Ask me questions while you tour the home.