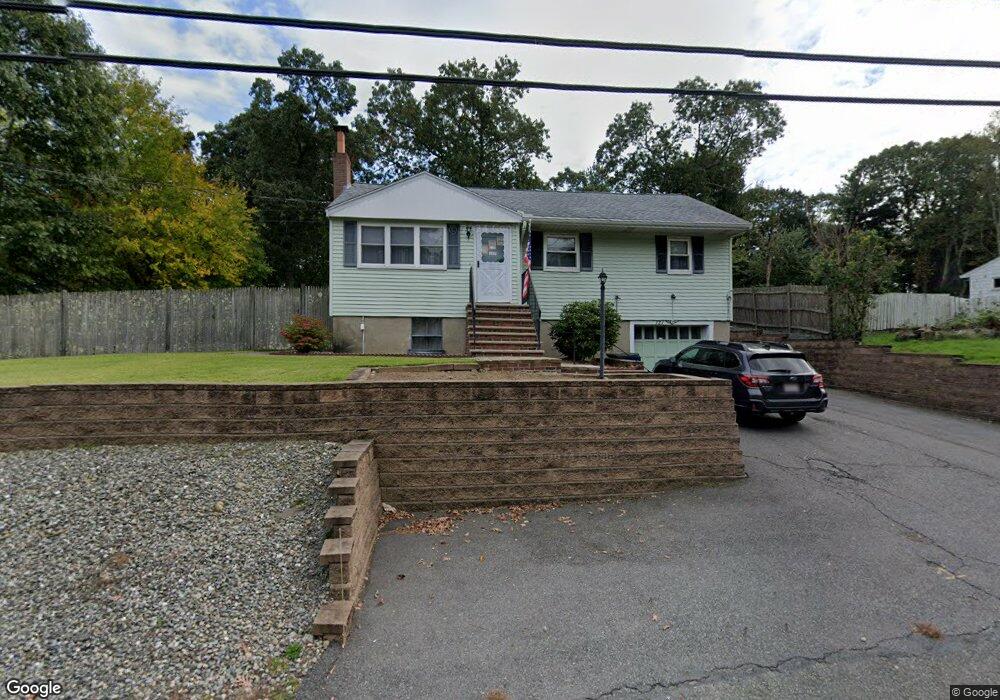
127 Center St Randolph, MA 02368
South Randolph NeighborhoodEstimated Value: $480,000 - $545,000
3
Beds
2
Baths
892
Sq Ft
$571/Sq Ft
Est. Value
About This Home
This home is located at 127 Center St, Randolph, MA 02368 and is currently estimated at $509,139, approximately $570 per square foot. 127 Center St is a home located in Norfolk County with nearby schools including Randolph High School, Boston Higashi School, and Lighthouse Baptist Christian Academy.
Ownership History
Date
Name
Owned For
Owner Type
Purchase Details
Closed on
Jul 23, 2024
Sold by
Swanson Douglas E and Swanson Jeanne M
Bought by
D E & Jeanne M Swanson Ft and Swanson
Current Estimated Value
Purchase Details
Closed on
Dec 14, 1983
Bought by
Swanson Douglas E
Create a Home Valuation Report for This Property
The Home Valuation Report is an in-depth analysis detailing your home's value as well as a comparison with similar homes in the area
Home Values in the Area
Average Home Value in this Area
Purchase History
| Date | Buyer | Sale Price | Title Company |
|---|---|---|---|
| D E & Jeanne M Swanson Ft | -- | None Available | |
| D E & Jeanne M Swanson Ft | -- | None Available | |
| Swanson Douglas E | $71,500 | -- |
Source: Public Records
Mortgage History
| Date | Status | Borrower | Loan Amount |
|---|---|---|---|
| Previous Owner | Swanson Douglas E | $35,000 |
Source: Public Records
Tax History
| Year | Tax Paid | Tax Assessment Tax Assessment Total Assessment is a certain percentage of the fair market value that is determined by local assessors to be the total taxable value of land and additions on the property. | Land | Improvement |
|---|---|---|---|---|
| 2025 | $5,492 | $473,000 | $243,400 | $229,600 |
| 2024 | $5,127 | $447,800 | $238,500 | $209,300 |
| 2023 | $4,960 | $410,600 | $216,700 | $193,900 |
| 2022 | $4,833 | $355,400 | $180,800 | $174,600 |
| 2021 | $4,724 | $319,600 | $150,700 | $168,900 |
| 2020 | $4,583 | $307,400 | $150,700 | $156,700 |
| 2019 | $4,395 | $293,400 | $143,300 | $150,100 |
| 2018 | $4,162 | $262,100 | $132,900 | $129,200 |
| 2017 | $3,823 | $236,300 | $126,500 | $109,800 |
| 2016 | $3,821 | $219,700 | $114,900 | $104,800 |
| 2015 | $3,729 | $206,000 | $109,600 | $96,400 |
Source: Public Records
Map
Nearby Homes
Your Personal Tour Guide
Ask me questions while you tour the home.