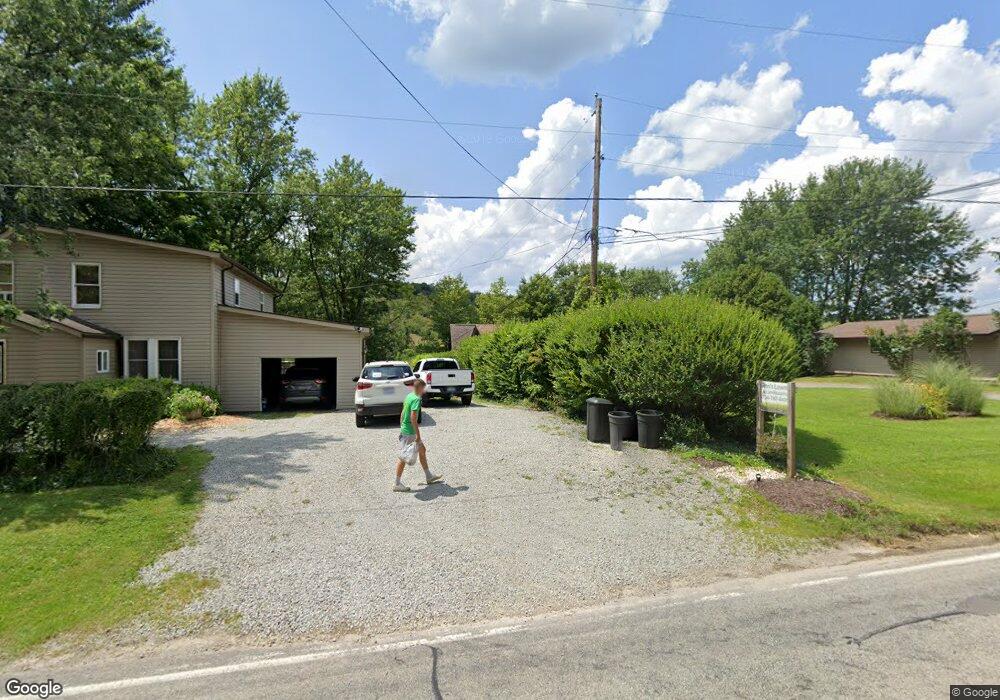
127 Charles Houck Rd Latrobe, PA 15650
Estimated Value: $217,000 - $249,079
--
Bed
--
Bath
896
Sq Ft
$261/Sq Ft
Est. Value
About This Home
This home is located at 127 Charles Houck Rd, Latrobe, PA 15650 and is currently estimated at $234,020, approximately $261 per square foot. 127 Charles Houck Rd is a home located in Westmoreland County with nearby schools including Greater Latrobe Junior High School and Greater Latrobe Senior High School.
Ownership History
Date
Name
Owned For
Owner Type
Purchase Details
Closed on
Aug 12, 2020
Sold by
Zimmerman Ronald and Zimmerman Sandra
Bought by
Bolen Danielle
Current Estimated Value
Home Financials for this Owner
Home Financials are based on the most recent Mortgage that was taken out on this home.
Original Mortgage
$170,848
Outstanding Balance
$151,554
Interest Rate
3%
Mortgage Type
FHA
Estimated Equity
$82,466
Create a Home Valuation Report for This Property
The Home Valuation Report is an in-depth analysis detailing your home's value as well as a comparison with similar homes in the area
Home Values in the Area
Average Home Value in this Area
Purchase History
| Date | Buyer | Sale Price | Title Company |
|---|---|---|---|
| Bolen Danielle | $174,000 | None Available |
Source: Public Records
Mortgage History
| Date | Status | Borrower | Loan Amount |
|---|---|---|---|
| Open | Bolen Danielle | $170,848 |
Source: Public Records
Tax History Compared to Growth
Tax History
| Year | Tax Paid | Tax Assessment Tax Assessment Total Assessment is a certain percentage of the fair market value that is determined by local assessors to be the total taxable value of land and additions on the property. | Land | Improvement |
|---|---|---|---|---|
| 2025 | $1,638 | $13,570 | $2,630 | $10,940 |
| 2024 | $1,638 | $13,570 | $2,630 | $10,940 |
| 2023 | $1,502 | $13,570 | $2,630 | $10,940 |
| 2022 | $1,502 | $13,570 | $2,630 | $10,940 |
| 2021 | $1,488 | $13,570 | $2,630 | $10,940 |
| 2020 | $1,465 | $13,570 | $2,630 | $10,940 |
| 2019 | $1,444 | $13,570 | $2,630 | $10,940 |
| 2018 | $1,438 | $13,570 | $2,630 | $10,940 |
| 2017 | $1,400 | $13,570 | $2,630 | $10,940 |
| 2016 | $328 | $13,570 | $2,630 | $10,940 |
| 2015 | $328 | $13,570 | $2,630 | $10,940 |
| 2014 | -- | $13,570 | $2,630 | $10,940 |
Source: Public Records
Map
Nearby Homes
- 3377 Pennsylvania 982
- 118 Lentz Rd
- 155 Smolleck St
- 153 Lentz Rd
- 157 Lentz Rd
- 1185 Murray Ave
- 1160 Murray Ave
- 509 Hancock St
- 4698 Pennsylvania 981
- 2122 Rte130
- 144 Sharon Dr (Lot 95)
- 138 Sharon Dr (Lot 98)
- 140 Sharon Dr (Lot 97)
- 134 Sharon Dr (Lot 100)
- 148 Sharon Dr (Lot 93)
- 146 Sharon Dr (Lot 94)
- 142 Sharon Dr (Lot 96)
- 136 Sharon Dr (Lot 99)
- 132 Sharon Dr (Lot 101)
- 130 Sharon Dr (Lot 102)
- 127 Charles Houck Rd
- 127 Charles Houck Rd
- 133 Charles Houck Rd
- 131 Charles Houck Rd
- 133 Charles Houck Rd Unit 2027
- 120 Charles Houck Rd
- 102 Musick Rd
- 3583 State Route 982
- 3570 State Route 982
- 3576 State Route 982
- 3586 State Route 982
- 125 Cupid Ln
- 3529 Pennsylvania 982
- 3501 State Route 982
- 107 Prancer Ln
- 126 Hughes Rd
- 150 Oak Hill Dr
- 150 Oak Hill Dr
- 3599 State Route 982
- 170 Oak Hill Dr