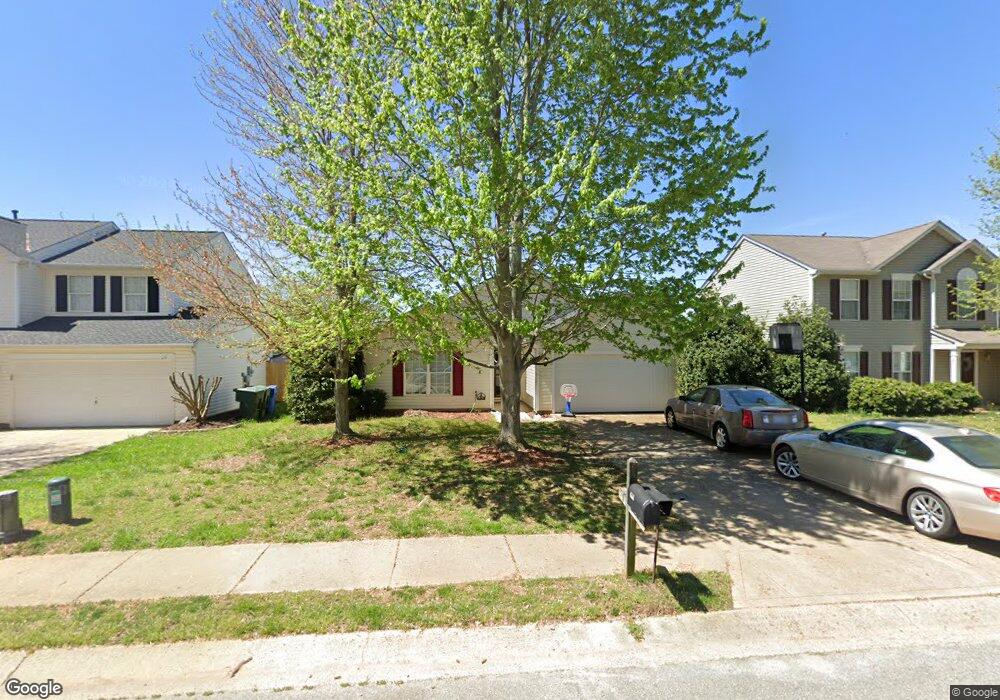
127 Cinebar Rd Mooresville, NC 28115
Estimated Value: $299,000 - $327,000
3
Beds
2
Baths
1,255
Sq Ft
$247/Sq Ft
Est. Value
About This Home
This home is located at 127 Cinebar Rd, Mooresville, NC 28115 and is currently estimated at $310,103, approximately $247 per square foot. 127 Cinebar Rd is a home located in Iredell County with nearby schools including Park View Elementary School, East Mooresville Intermediate School, and Mooresville Middle.
Ownership History
Date
Name
Owned For
Owner Type
Purchase Details
Closed on
Dec 27, 2013
Sold by
Kinder John
Bought by
Ingle Sharon A
Current Estimated Value
Purchase Details
Closed on
Mar 14, 2012
Sold by
Kinder John and Kinder Ann
Bought by
Kinder John
Purchase Details
Closed on
Aug 15, 2003
Sold by
Davis Lisa A and Davis James W
Bought by
Kinder John and Kinder Ann
Home Financials for this Owner
Home Financials are based on the most recent Mortgage that was taken out on this home.
Original Mortgage
$113,400
Interest Rate
5.5%
Mortgage Type
Purchase Money Mortgage
Purchase Details
Closed on
Oct 30, 2000
Sold by
The Ryland Group Inc
Bought by
Disbro Lisa A
Home Financials for this Owner
Home Financials are based on the most recent Mortgage that was taken out on this home.
Original Mortgage
$91,500
Interest Rate
7.91%
Create a Home Valuation Report for This Property
The Home Valuation Report is an in-depth analysis detailing your home's value as well as a comparison with similar homes in the area
Home Values in the Area
Average Home Value in this Area
Purchase History
| Date | Buyer | Sale Price | Title Company |
|---|---|---|---|
| Ingle Sharon A | $120,000 | None Available | |
| Kinder John | -- | None Available | |
| Kinder John | $126,000 | -- | |
| Disbro Lisa A | $114,500 | -- |
Source: Public Records
Mortgage History
| Date | Status | Borrower | Loan Amount |
|---|---|---|---|
| Previous Owner | Kinder John | $113,400 | |
| Previous Owner | Disbro Lisa A | $91,500 |
Source: Public Records
Tax History Compared to Growth
Tax History
| Year | Tax Paid | Tax Assessment Tax Assessment Total Assessment is a certain percentage of the fair market value that is determined by local assessors to be the total taxable value of land and additions on the property. | Land | Improvement |
|---|---|---|---|---|
| 2024 | $3,903 | $286,150 | $50,000 | $236,150 |
| 2023 | $3,438 | $286,150 | $50,000 | $236,150 |
| 2022 | $2,152 | $151,720 | $26,000 | $125,720 |
| 2021 | $2,152 | $151,720 | $26,000 | $125,720 |
| 2020 | $2,152 | $151,720 | $26,000 | $125,720 |
| 2019 | $2,137 | $151,720 | $26,000 | $125,720 |
| 2018 | $1,881 | $132,200 | $32,000 | $100,200 |
| 2017 | $1,821 | $132,200 | $32,000 | $100,200 |
| 2016 | $1,821 | $132,200 | $32,000 | $100,200 |
| 2015 | -- | $131,040 | $32,000 | $99,040 |
| 2014 | -- | $133,190 | $32,000 | $101,190 |
Source: Public Records
Map
Nearby Homes
- 102 Brewster Ct
- 275 Flanders Dr
- 129 Bosburg Dr
- 120 Creek Branch Dr
- 00 Laura Rd
- 153 Creek Branch Dr
- 2209 Charlotte Hwy
- 136 Sequoia Forest Dr
- 0 Mazeppa Rd Unit 3762905
- 210 Mazeppa Rd
- 141 Stafford Ln
- 133 Lassen Ln
- 0000 S Iredell Industrial Park Rd
- 270 Kilmer Ln
- 330 Kilmer Ln
- 2038 Charlotte Hwy
- 161 Wrangell Dr
- 202 Wrangell Dr
- 175 Limerick Rd Unit C
- 155 Limerick Rd Unit D
- 131 Cinebar Rd
- 110 Creston Ct
- 135 Cinebar Rd
- 119 Cinebar Rd
- 106 Creston Ct
- 114 Creston Ct
- 118 Creston Ct
- 102 Creston Ct
- 102 Creston Ct Unit 112
- 128 Cinebar Rd
- 124 Cinebar Rd
- 139 Cinebar Rd
- 132 Cinebar Rd
- 120 Cinebar Rd
- 122 Creston Ct
- 136 Cinebar Rd
- 116 Cinebar Rd
- 143 Cinebar Rd
- 111 Creston Ct
- 126 Creston Ct