127 Cleremont Dr Fredericksburg, VA 22405
Highland Home NeighborhoodEstimated Value: $576,000 - $622,000
4
Beds
3
Baths
2,880
Sq Ft
$205/Sq Ft
Est. Value
About This Home
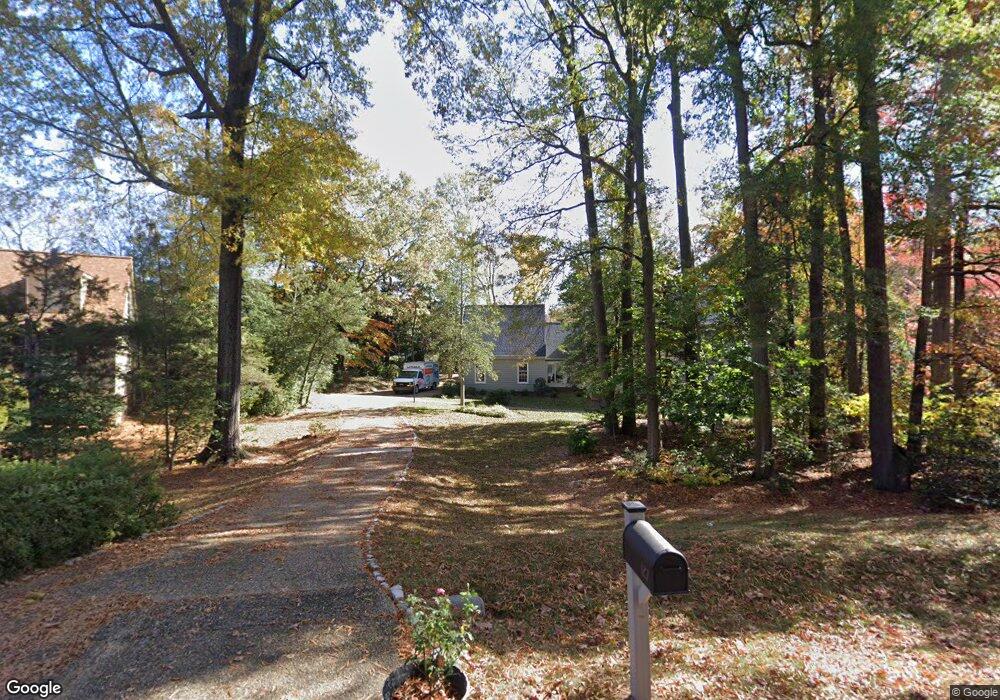
This home is located at 127 Cleremont Dr, Fredericksburg, VA 22405 and is currently estimated at $591,254, approximately $205 per square foot. 127 Cleremont Dr is a home located in Stafford County with nearby schools including Conway Elementary School, Donald B. Dixon-Lyle R. Smith Middle School, and Stafford Senior High School.
Ownership History
Date
Name
Owned For
Owner Type
Purchase Details
Closed on
Feb 18, 2022
Sold by
Dowling Michael T and Dowling Janet B
Bought by
Sontheimer Glenn D and Sontheimer Gina R
Current Estimated Value
Home Financials for this Owner
Home Financials are based on the most recent Mortgage that was taken out on this home.
Original Mortgage
$399,200
Outstanding Balance
$370,687
Interest Rate
3.55%
Mortgage Type
New Conventional
Estimated Equity
$220,567
Create a Home Valuation Report for This Property
The Home Valuation Report is an in-depth analysis detailing your home's value as well as a comparison with similar homes in the area
Home Values in the Area
Average Home Value in this Area
Purchase History
| Date | Buyer | Sale Price | Title Company |
|---|---|---|---|
| Sontheimer Glenn D | $499,000 | Commonwealth Land Title |
Source: Public Records
Mortgage History
| Date | Status | Borrower | Loan Amount |
|---|---|---|---|
| Open | Sontheimer Glenn D | $399,200 |
Source: Public Records
Tax History Compared to Growth
Tax History
| Year | Tax Paid | Tax Assessment Tax Assessment Total Assessment is a certain percentage of the fair market value that is determined by local assessors to be the total taxable value of land and additions on the property. | Land | Improvement |
|---|---|---|---|---|
| 2025 | $4,141 | $456,700 | $125,000 | $331,700 |
| 2024 | $4,141 | $456,700 | $125,000 | $331,700 |
| 2023 | $3,401 | $359,900 | $125,000 | $234,900 |
| 2022 | $3,059 | $359,900 | $125,000 | $234,900 |
| 2021 | $3,152 | $324,900 | $90,000 | $234,900 |
| 2020 | $3,152 | $324,900 | $90,000 | $234,900 |
| 2019 | $3,226 | $319,400 | $90,000 | $229,400 |
| 2018 | $3,162 | $319,400 | $90,000 | $229,400 |
| 2017 | $3,162 | $319,400 | $90,000 | $229,400 |
| 2016 | $3,162 | $319,400 | $90,000 | $229,400 |
| 2015 | -- | $317,200 | $90,000 | $227,200 |
| 2014 | -- | $317,200 | $90,000 | $227,200 |
Source: Public Records
Map
Nearby Homes