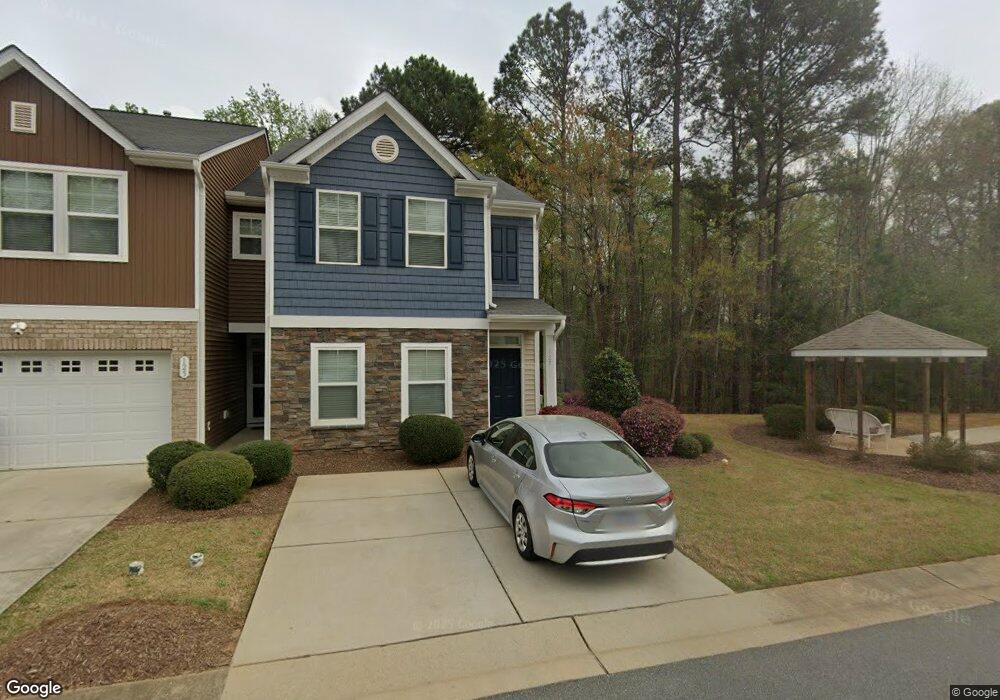
127 Cobalt Creek Way Holly Springs, NC 27540
Estimated Value: $285,690 - $310,000
2
Beds
3
Baths
1,164
Sq Ft
$254/Sq Ft
Est. Value
About This Home
This home is located at 127 Cobalt Creek Way, Holly Springs, NC 27540 and is currently estimated at $295,173, approximately $253 per square foot. 127 Cobalt Creek Way is a home located in Wake County with nearby schools including Holly Springs Elementary School, Holly Ridge Middle School, and Apex Friendship High School.
Ownership History
Date
Name
Owned For
Owner Type
Purchase Details
Closed on
Oct 27, 2016
Sold by
Stephenson Andrew E and Mong Chuu
Bought by
Baughman Richard
Current Estimated Value
Purchase Details
Closed on
Aug 8, 2012
Sold by
Goldston James D and Goldston Louise F
Bought by
Garman Homes Llc
Home Financials for this Owner
Home Financials are based on the most recent Mortgage that was taken out on this home.
Original Mortgage
$171,500
Interest Rate
3.65%
Mortgage Type
Seller Take Back
Purchase Details
Closed on
Jan 11, 2012
Sold by
Garman Homes Llc
Bought by
Stephenson Andrew E
Home Financials for this Owner
Home Financials are based on the most recent Mortgage that was taken out on this home.
Original Mortgage
$129,591
Interest Rate
3.36%
Mortgage Type
New Conventional
Create a Home Valuation Report for This Property
The Home Valuation Report is an in-depth analysis detailing your home's value as well as a comparison with similar homes in the area
Home Values in the Area
Average Home Value in this Area
Purchase History
| Date | Buyer | Sale Price | Title Company |
|---|---|---|---|
| Baughman Richard | $161,000 | None Available | |
| Garman Homes Llc | $175,000 | None Available | |
| Stephenson Andrew E | $127,000 | None Available |
Source: Public Records
Mortgage History
| Date | Status | Borrower | Loan Amount |
|---|---|---|---|
| Previous Owner | Garman Homes Llc | $171,500 | |
| Previous Owner | Stephenson Andrew E | $129,591 |
Source: Public Records
Tax History Compared to Growth
Tax History
| Year | Tax Paid | Tax Assessment Tax Assessment Total Assessment is a certain percentage of the fair market value that is determined by local assessors to be the total taxable value of land and additions on the property. | Land | Improvement |
|---|---|---|---|---|
| 2025 | $1,260 | $288,115 | $70,000 | $218,115 |
| 2024 | $1,255 | $288,115 | $70,000 | $218,115 |
| 2023 | $986 | $179,062 | $40,000 | $139,062 |
| 2022 | $952 | $179,062 | $40,000 | $139,062 |
| 2021 | $1,849 | $179,062 | $40,000 | $139,062 |
| 2020 | $1,849 | $179,062 | $40,000 | $139,062 |
| 2019 | $1,758 | $144,420 | $25,000 | $119,420 |
| 2018 | $1,590 | $144,420 | $25,000 | $119,420 |
| 2017 | $1,533 | $144,420 | $25,000 | $119,420 |
| 2016 | $1,512 | $144,420 | $25,000 | $119,420 |
| 2015 | $1,300 | $122,004 | $22,000 | $100,004 |
| 2014 | $1,256 | $122,004 | $22,000 | $100,004 |
Source: Public Records
Map
Nearby Homes
- 112 Sanchez Ct
- 208 Apple Drupe Way
- 1539 N Main St
- 105 Arbor Wynds Ct
- 329 N Main St
- 201 Holmby Ct
- 3906 Mc Clain St
- 317 Commons Dr
- 201 Adefield Ln
- 128 Canford Way
- 148 Danesway Dr
- 109 Bright Shade Ct
- 725 Little Leaf Ct
- 300 Firefly Rd
- 717 Starkland Way
- 105 Townsgate Ct
- 108 Bella Place
- 0 Old Ride Dr
- 318 Blalock St
- 321 Blalock St
- 125 Cobalt Creek Way
- 9136 Cobalt Creek Way
- 123 Cobalt Creek Way
- 121 Cobalt Creek Way
- 119 Cobalt Creek Way
- 114 Cobalt Creek Way
- 116 Cobalt Creek Way
- 112 Cobalt Creek Way
- 110 Cobalt Creek Way
- 120 Cobalt Creek Way
- 108 Cobalt Creek Way
- 122 Cobalt Creek Way
- 111 Cobalt Creek Way
- 115 Cobalt Creek Way
- 106 Cobalt Creek Way
- 124 Cobalt Creek Way
- 104 Cobalt Creek Way
- 126 Cobalt Creek Way
- 128 Cobalt Creek Way
- 133 Cobalt Creek Way Unit lot 23