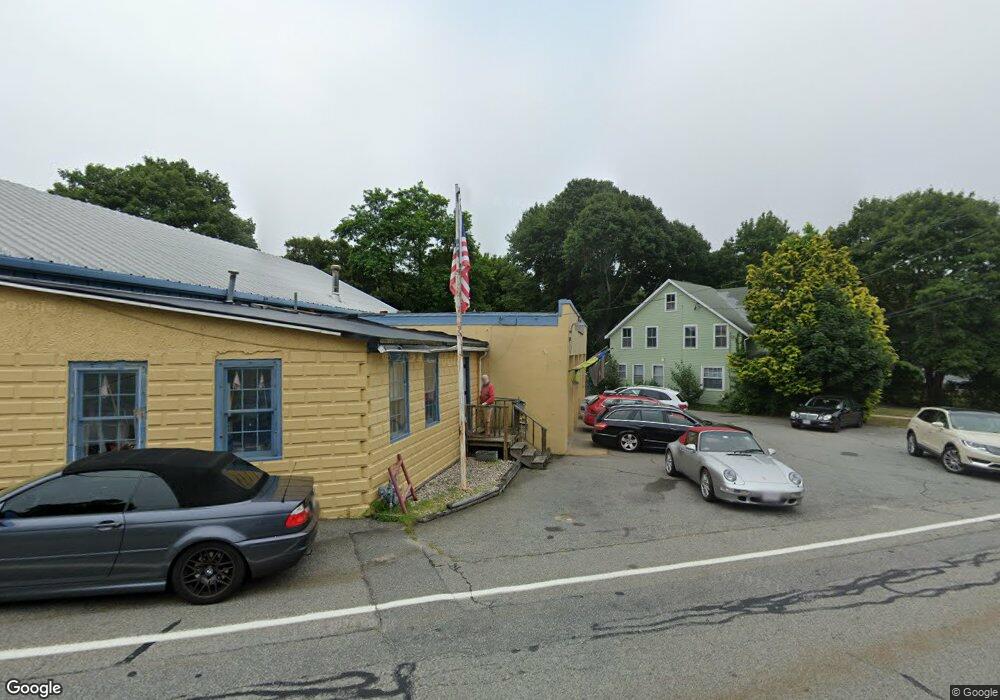
127 County Rd North Falmouth, MA 2556
North Falmouth NeighborhoodEstimated Value: $523,546
--
Bed
2
Baths
1,940
Sq Ft
$270/Sq Ft
Est. Value
About This Home
This home is located at 127 County Rd, North Falmouth, MA 2556 and is currently estimated at $523,546, approximately $269 per square foot. 127 County Rd is a home located in Barnstable County with nearby schools including North Falmouth Elementary School, Morse Pond School, and Lawrence School.
Ownership History
Date
Name
Owned For
Owner Type
Purchase Details
Closed on
Apr 18, 2022
Sold by
Sports Imports Of Cape Co
Bought by
John Scott Mcnamara Ret and Mcnamara
Current Estimated Value
Purchase Details
Closed on
Mar 24, 1995
Sold by
Noyes Elise A
Bought by
Sports Imports Cape Cd
Home Financials for this Owner
Home Financials are based on the most recent Mortgage that was taken out on this home.
Original Mortgage
$128,200
Interest Rate
8.78%
Mortgage Type
Commercial
Purchase Details
Closed on
Jan 4, 1993
Sold by
County Rd Properties
Bought by
Noyes Roger F and Noyes Elise A
Purchase Details
Closed on
Jun 24, 1987
Sold by
Knoll Peter M
Bought by
County Rd Prop Inc
Create a Home Valuation Report for This Property
The Home Valuation Report is an in-depth analysis detailing your home's value as well as a comparison with similar homes in the area
Home Values in the Area
Average Home Value in this Area
Purchase History
| Date | Buyer | Sale Price | Title Company |
|---|---|---|---|
| John Scott Mcnamara Ret | -- | None Available | |
| John Scott Mcnamara Ret | -- | None Available | |
| Sports Imports Cape Cd | $128,200 | -- | |
| Sports Imports Cape Cd | $128,200 | -- | |
| Noyes Roger F | $157,369 | -- | |
| Noyes Roger F | $157,369 | -- | |
| County Rd Prop Inc | $175,000 | -- |
Source: Public Records
Mortgage History
| Date | Status | Borrower | Loan Amount |
|---|---|---|---|
| Previous Owner | County Rd Prop Inc | $128,200 |
Source: Public Records
Tax History Compared to Growth
Tax History
| Year | Tax Paid | Tax Assessment Tax Assessment Total Assessment is a certain percentage of the fair market value that is determined by local assessors to be the total taxable value of land and additions on the property. | Land | Improvement |
|---|---|---|---|---|
| 2025 | $3,284 | $559,500 | $347,200 | $212,300 |
| 2024 | $3,240 | $516,000 | $315,000 | $201,000 |
| 2023 | $3,128 | $452,000 | $276,400 | $175,600 |
| 2022 | $3,173 | $394,100 | $223,200 | $170,900 |
| 2021 | $3,267 | $384,400 | $213,500 | $170,900 |
| 2020 | $3,302 | $384,400 | $213,500 | $170,900 |
| 2019 | $3,035 | $354,500 | $199,500 | $155,000 |
| 2018 | $2,896 | $335,200 | $180,200 | $155,000 |
| 2017 | $2,766 | $324,300 | $172,900 | $151,400 |
| 2016 | $2,714 | $324,300 | $172,900 | $151,400 |
| 2015 | $2,656 | $324,300 | $172,900 | $151,400 |
| 2014 | $2,832 | $347,500 | $122,800 | $224,700 |
Source: Public Records
Map
Nearby Homes
- 289 Old Main Rd
- 48 Garnet Ave
- 23 Wohelo Dr
- 2 Tricia Rd
- 31 Baxendale Rd
- 24 Fiddlers Cove Rd
- 14 Ryder Rd
- 37 Five Gate Ln
- 250 Scraggy Neck Rd
- 10 Squeteague Harbor Rd
- 74 Hillside Ave
- 9 Seascape Ln
- 75 Winsor Rd
- 267 N Falmouth Hwy
- 1234 Route 28a
- 213 N Falmouth Hwy Unit 5A
- 213 N Falmouth Hwy Unit 5B
- 213 N Falmouth Hwy Unit 5 A
- 1234 Route 28a
- 131 County Rd
- 121 County Rd
- 1 Garnet Ave
- 115 County Rd
- 115 County Rd
- 3 Chester St
- 5 Garnet Ave
- 6 Chester St
- 138 County Rd
- 11 Chester St
- 11 Chester St Unit 3
- 11 Chester St Unit 9C
- 141 County Rd Unit D
- 141 County Rd Unit C
- 141 County Rd Unit B
- 141 County Rd Unit A
- 141 County Rd
- 11 Garnet Ave
- 111 County Rd
- 109 County Rd